Advanced Kanban Metrics
Kanban practitioners rely on a set of strong, standard metrics such as cycle time for measuring active processing time, throughput for tracking delivery speed over time, and cumulative flow for gauging workflow stability. While basic metrics are valuable on their own, relying solely on them can provide only a partial view - they summarize what happened, but not why it happened or what might happen next. A mature Kanban system requires an additional layer of analysis to accurately diagnose its health and structural limitations, and to guide data-driven decisions.
This article explores three additional dimensions of Kanban process insight: flow efficiency, blocker clustering, and demand analysis. Carefully interpreted, these metrics can expand your Kanban from a visualization board to an organizational intelligence system.
Flow efficiency
This metric is to your team what traffic congestion is to a commuter: both determine arrival times. Just as a commuter wants to know when they’ll reach their destination, your customers want to know when you’ll finish the work they’ve contracted you to do.
Flow efficiency is the ratio between active working time and total lead time. Represented by a percentage value, it’s calculated as:

Example If a task takes 48 hours of active work to complete but spends a total of 8 days on the board - waiting times included - the flow efficiency is 25%.
This value can expose an uncomfortable truth: many Kanban systems suffer a low flow efficiency; it’s not rare for it to dwindle in the single digits. It shows that the majority of time isn’t devoted to creating value for customers, but waiting for something to happen: a dependency to lift, a review to complete, or a team member’s availability.
However, low efficiency does not automatically prove a poor system design, provided that the workflow includes a deliberate balancing of the cost of delays against flow variability. Such built-in inefficiency can help absorb unpredictability that would otherwise cause greater delays over time.
Conversely, high flow efficiency doesn’t necessarily mean high productivity. It can also indicate that the system is underutilized and/or overstaffed, causing work items to be pushed through at a pace that leaves all queues nearly empty.
What’s the point of measuring it then? The point is in recognizing the patterns of inefficiency:
- Are the waiting times longest at specific process steps?
- Is work usually waiting for an external review, or for internal team availability?
- Are specific card types consistently lacking in their efficiency?
Monitoring flow efficiency enables you to identify where bottlenecks are likely to emerge within the process, while also providing a practical incentive for the team to maintain real-time updates on the board.
How to use it?
Plot flow efficiency trends per workflow state and work type. If the Testing stage usually falls below 10% efficiency, while Analysis remains at 60%, the constraint is not due to the team - it’s systemic; tied to staffing ratios or code review bottlenecks.
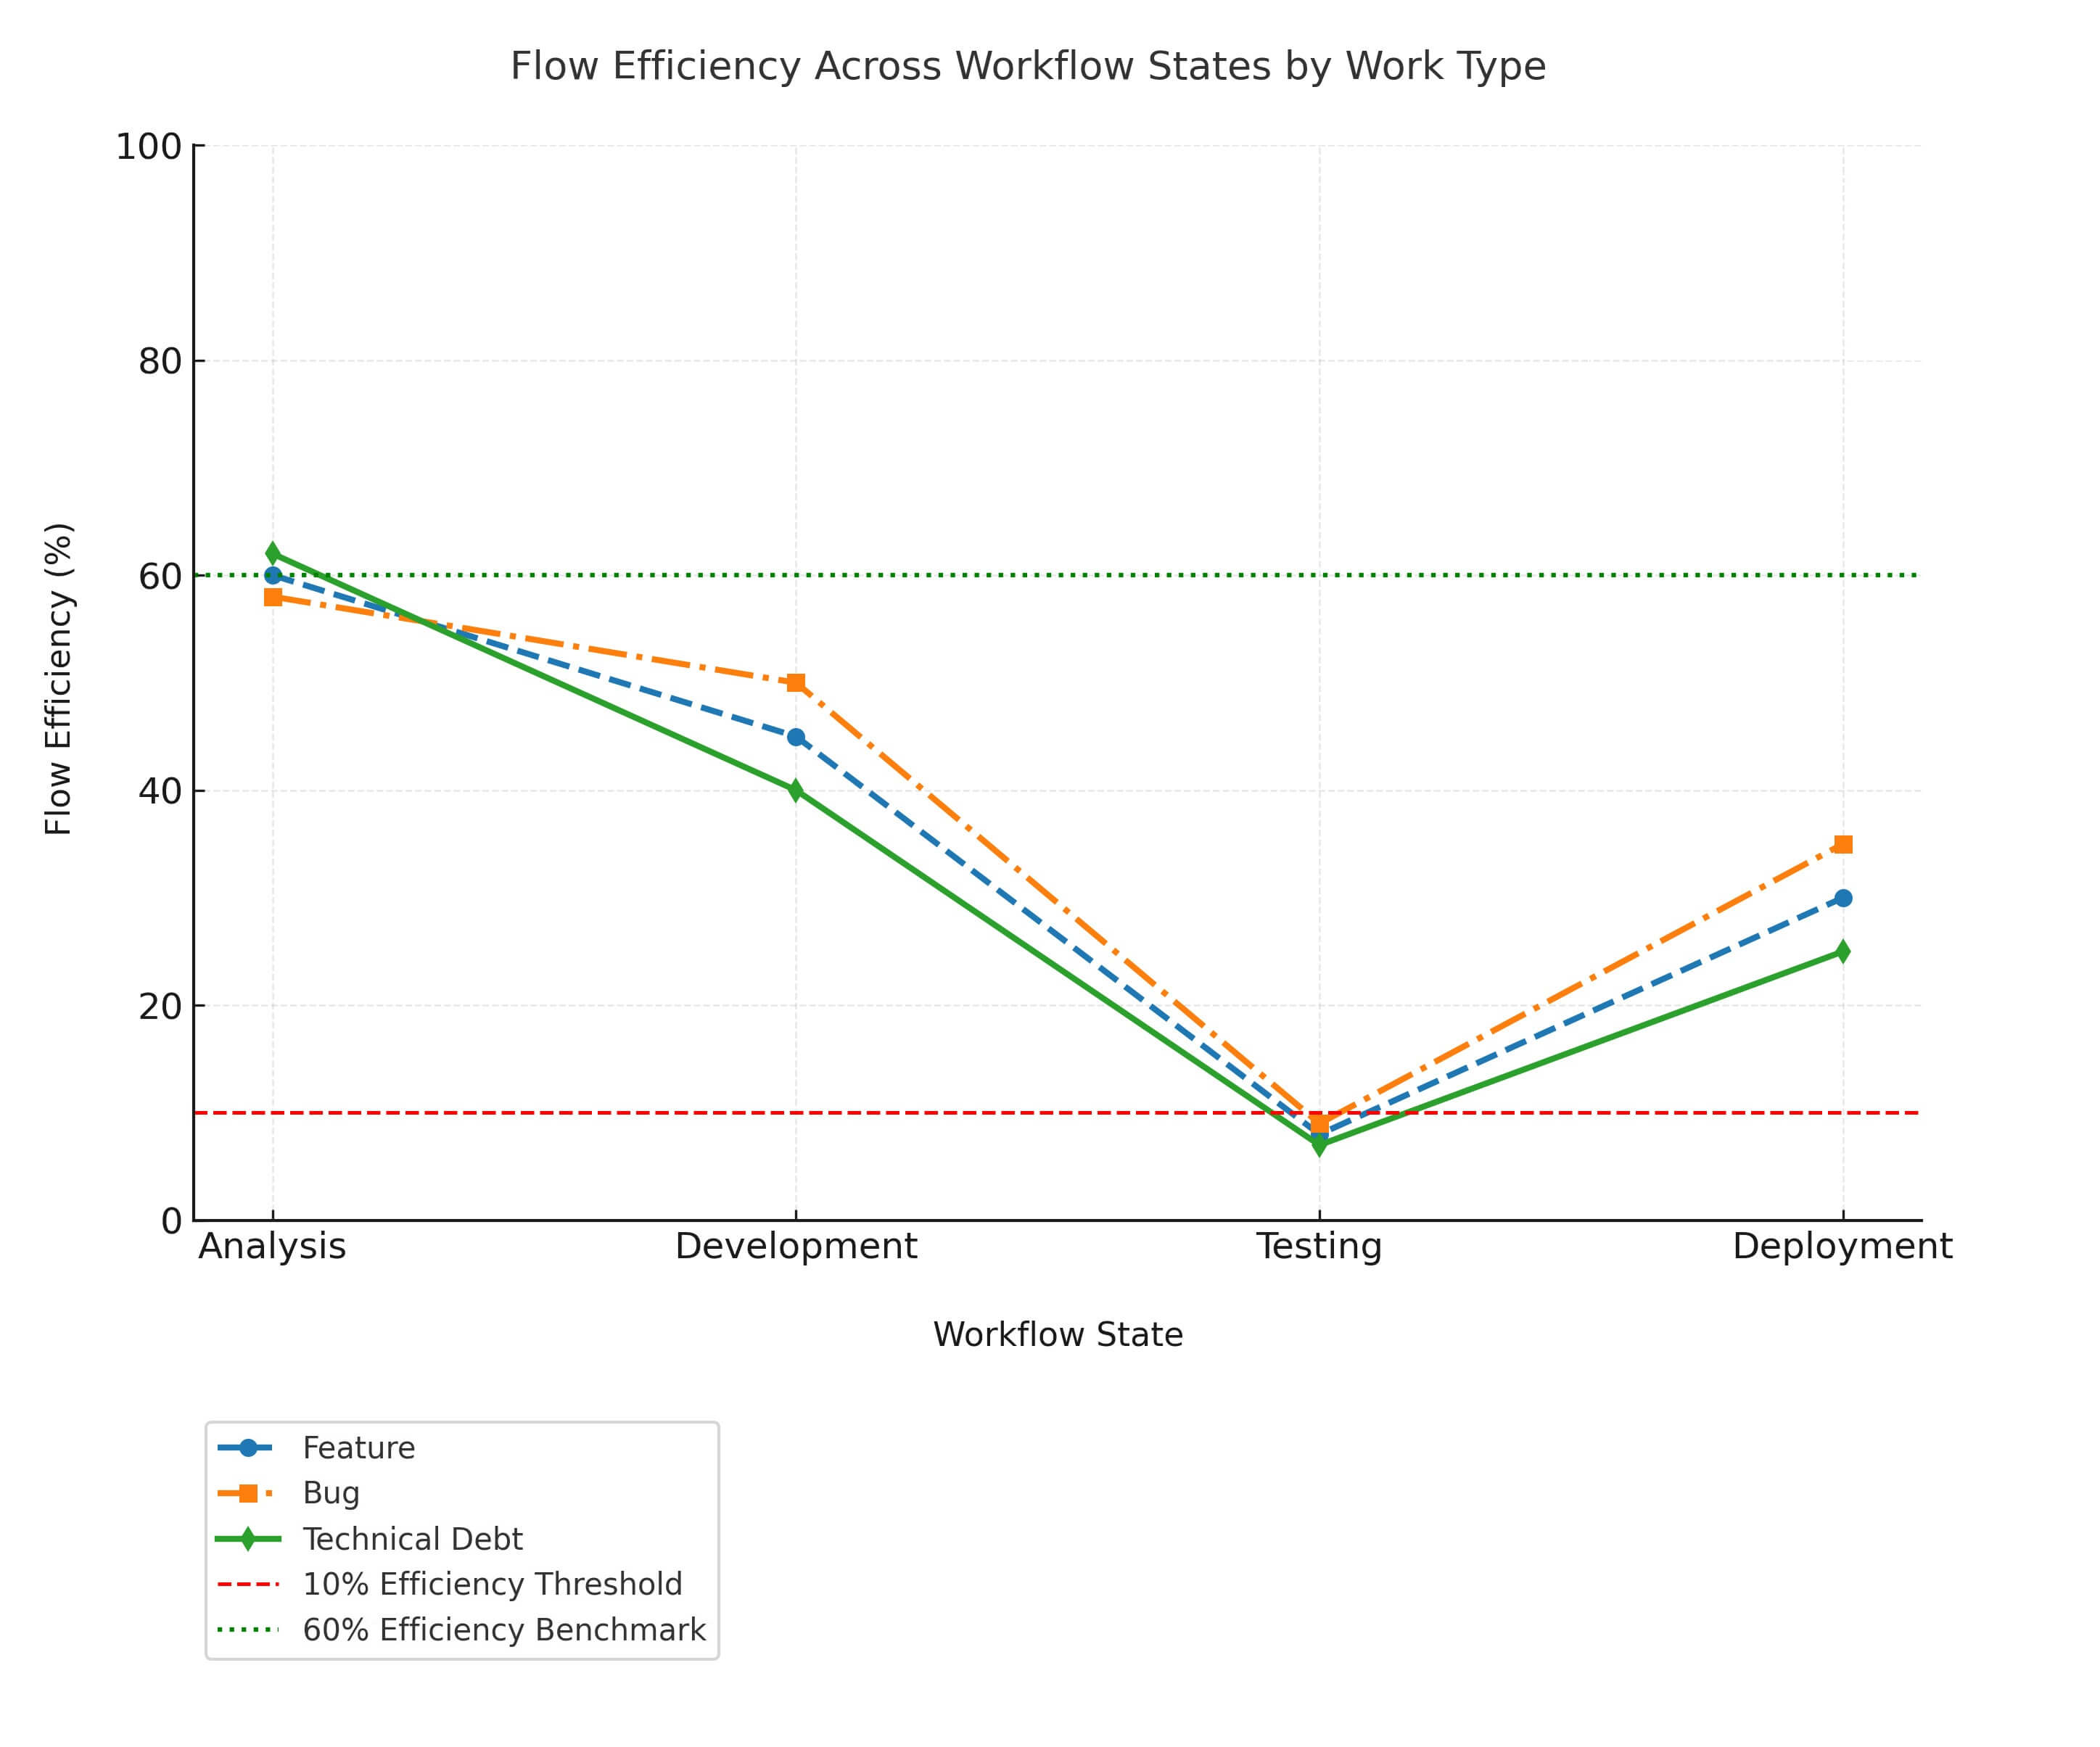
You may also use the flow efficiency value to cross-analyze it with the tasks arrival rate volatility: if your system is overloaded, waiting times grow, proving a sensitivity to demand fluctuations.
Blocker clustering
Every Kanban board stores a hidden record of process stoppages. While blocked tasks are often regarded as short-term obstacles, their patterns over time can expose the fundamental operational issues within your team. Blocker clustering is a systematic analysis of these patterns of obstruction.
How to use it?
Whenever a card is blocked, tag it with a categorical label.
Example
- Dependency on another team
- Incomplete information
- Environment instability
- External approval
- Waiting for a decision
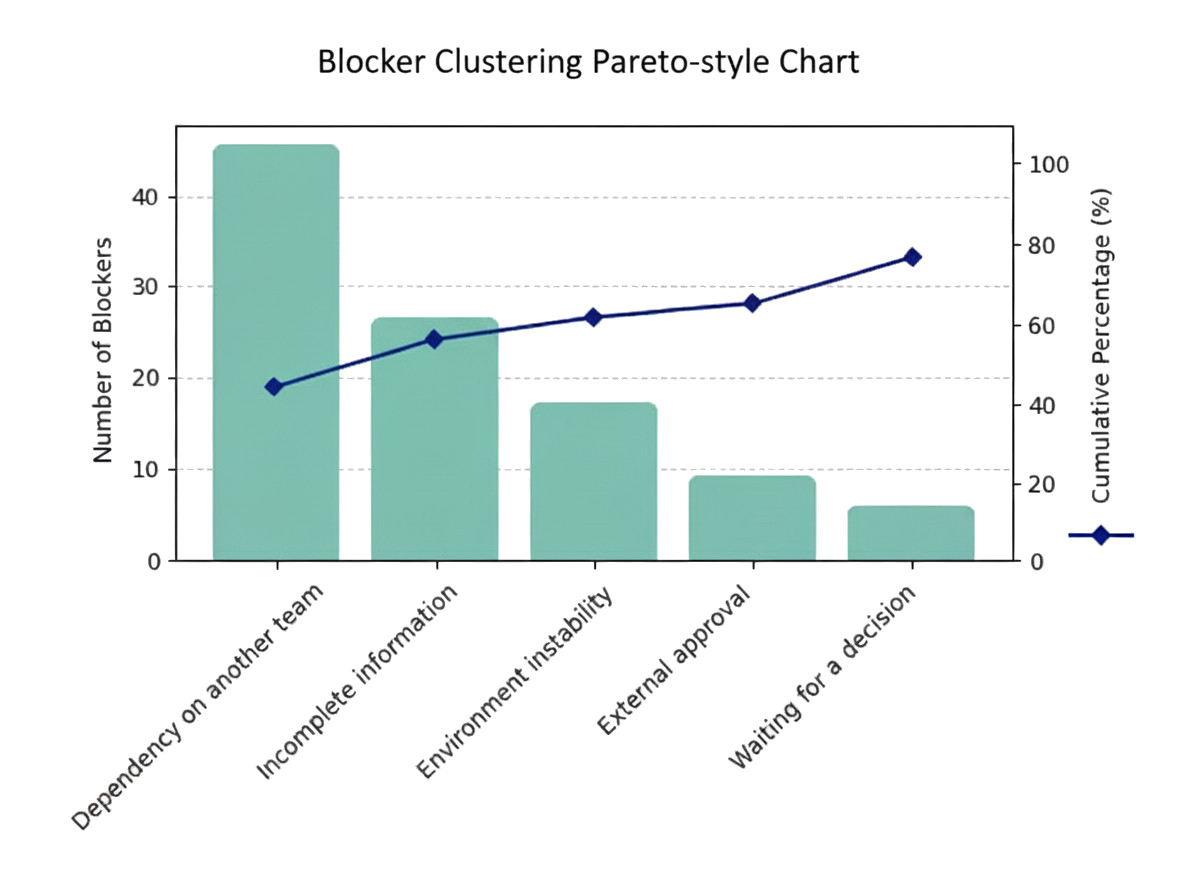
Over weeks and months, you can visualize these labels as a blocker clustering map - a straightforward Pareto-style chart showing which causes dominate.
On the chart:
The bars represent the frequency of each blocker type/label, and the dark blue line marks the cumulative percentage, helping identify which blockers contribute most to stoppages.
For example, the top two blockers (Dependency on another team and Incomplete information) account for ~ 60% of all issues; a classic Pareto 80/20 insight.
Blocker clustering insights
- Separation of systemic and random friction: If the majority of blockers are caused by dependency on external teams, your “flow problem” is stemming from an organizational design flaw.
- Distinction between chronic and acute issues: Many blockers are transient, for example, a missed deployment slot or a team member diverted to a more urgent task. Others are persistent, such as recurring dependencies that indicate unclear ownership or gaps in team competencies.
- Early problem prediction: Analyzing blocker frequency over time can operate as an indicator of process health, e.g., an unexpected increase of “Waiting for review” blockers can signal a queue forming before it is manifested in late delivery.

It should be noted that the purpose of blocker clustering is not to remove all blockers; a Kanban system entirely free of blockers would either misrepresent reality or remain idle. The aim is to build awareness of blocker patterns, to understand which interruption types are natural and temporary, which are structural and recurring, and which could be addressed with a better system design. For example:
- If external dependencies dominate, consider reducing your reliance on external partners or building strict service agreements to guide the external cooperation.
- If decision delays are frequent, your system might be suffering from unclear governance or over-centralized authority.
- If your environment instability persists or grows, the technical debt stops being a local issue; it has graduated to becoming a flow constraint that needs addressing systemically.
Did you know?
Kanban Tool® boards automatically track performance metrics as a team progresses through tasks in a workflow customized to their needs. For deeper analysis, flow data can be exported to a spreadsheet or connected to specialized analytics tools via API.
Demand analysis
Kanban operates as a pull-based process, with work items addressed as system capacity allows. However, many teams approach demand as an external metric, targeting a set number of completions per week and ignoring variability in task size and priority. An advanced Kanban practice must be cognizant that understanding and shaping demand is equally critical to flow management.
Understanding demand
Process demand is never homogeneous; all backlog items compete for attention, but they carry different weights, urgency, and predictability. The goal of demand analysis is to answer questions such as:
- What percentage of work arrives from unplanned vs. planned sources?
- How does demand vary across classes of service?
- Is the new work arrival rate increasing faster than our throughput capacity?
- How does incoming work vary over time?
How to use it?
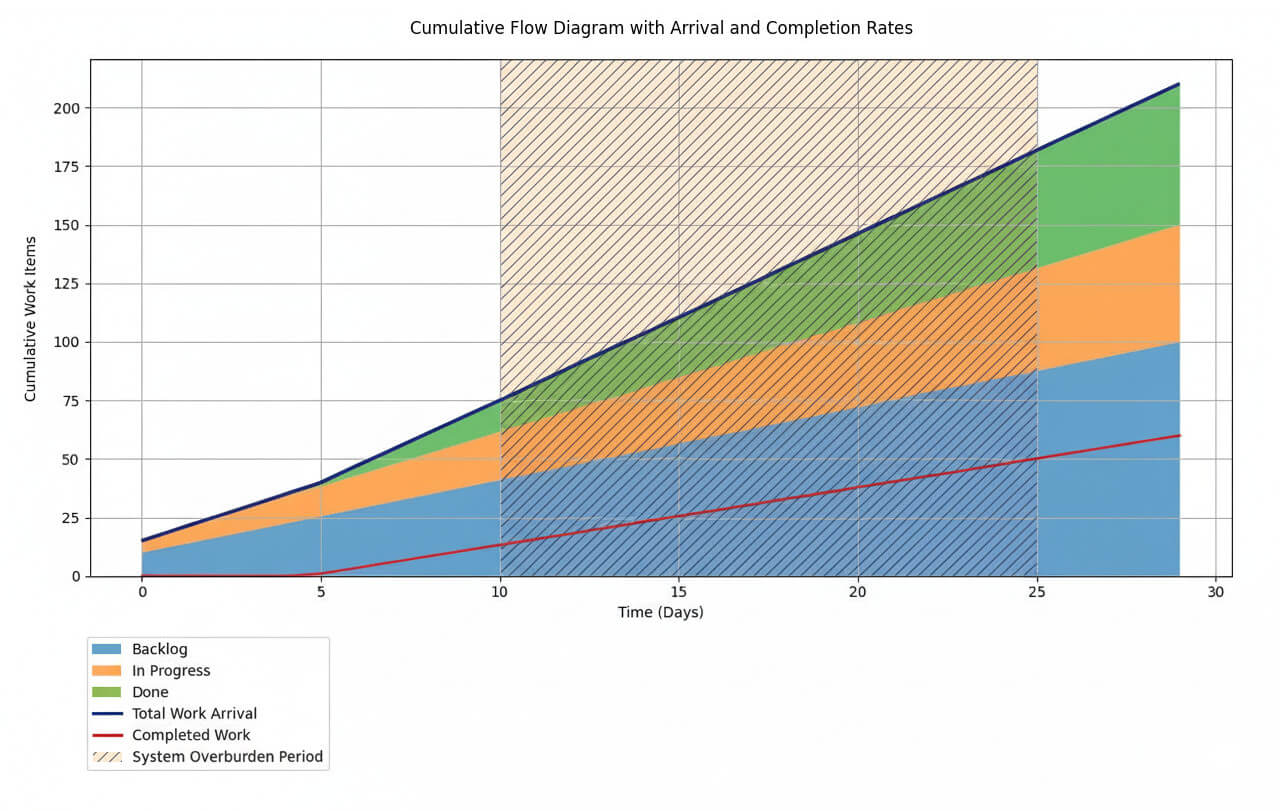
A helpful visualization is a cumulative flow diagram annotated with arrival rate lines and completion rate slopes. When the arrival rate consistently exceeds throughput, the system becomes overloaded, causing lead times to grow and predictability to decline.
On the chart:
The dark blue line marks new work arrival rate (backlog growth).
The red line highlights the completion rate (done items).
The striped vertical area marks the overburden period - the widening gap between arrival and completion lines. Overloading the system leads to increased lead times, lower predictability and an expansion of work in progress.
This visualization helps answer questions like:
- Is the team taking on more work than it can finish?
- How does demand fluctuate?
- Which workflow states are accumulating the most work?
A more advanced demand analysis might also include:
- Arrival rate volatility (ARV): The average number of incoming tasks over a period. High ARV flows usually require more buffer capacity and/or an adaptive WIP limit.
- Demand composition ratio (DCR): The ratio between new work items, maintenance tasks, and support tickets. Fluctuations in DCR over time can predict changes in strategic alignment.
- Cost of delay density: Measuring not just the number of delayed tasks, but the value lost over time. Analyzing demand by urgency or impact, rather than volume alone, reveals how sensitive a system is to prioritization mistakes.
From measurement to policy
Demand analysis can also guide explicit Kanban policies. For example:
- When ARV is high, a team may adopt WIP limits that adjust dynamically along with the observed demand.
- When unplanned demand exceeds a set threshold, a triage swimlane could be added to isolate emergency tasks from the predictable flow.
- When a given class of service (e.g., expedite) dominates the board, it’s a symptom of the system lacking slack or definite prioritization rules upstream.
A careful demand analysis can transform your Kanban system planning from reactive to adaptive, synchronizing flow capacity with factual, evidence-based demand levels.
Beyond numbers: Integrating metrics into system thinking
Each of the advanced metrics described serves as a powerful diagnostic tool on its own. Greater analytical insight, however, emerges when they are analyzed in combination.
For instance, a low flow efficiency correlated with a high volume of dependency blockers indicates structural coupling. A stable throughput accompanied by rising blocker duration suggests an increasing system fragility - it is delivering, but internal tensions are rising. Volatile demand paired with growing efficiency variance uncovers a misalignment between arrival predictability and team flexibility.
These complex interrelationships define the unique systemic signature of your Kanban implementation. Beyond informing local improvements, they can drive strategic actions, including modifying organizational interfaces, reassessing capacity allocation, or renegotiating demand agreements with stakeholders.

The discipline of measurement
Advanced Kanban metrics are precise instruments for operational learning, demanding rigorous data collection, truthful reporting, and an openness to interpret ambiguity.
Flow efficiency challenges complacency regarding waiting times.
Blocker clustering reveals where the organization is resisting flow.
Demand analysis reveals the upstream factors that quietly govern downstream processes.
Together, these metrics reflect a higher level of Kanban maturity, where tracking shifts from performance monitoring to revealing hidden dynamics, enabling the system to evolve deliberately.