Managing and Measuring Flow

What is flow?
In the project management context, flow is how an item, information, or piece of work, moves through a business process. It’s the way it navigates various departments or moves across the production floor. It is not so much the repeatable route work takes, but the one-time experience of an item traveling through the process. Does an item move through all departments unencumbered, or does it suffer interruptions along the way?
If you’ve ever experienced frustration while having to start and stop work on an engaging task several times a day, then you might already be aware that this irritation stems directly from you having your flow interrupted.
The first Kanban practice, visualizing the workflow, shows how an item moves through a process. The second one, limiting work in progress, ensures that team members are not slowing down the process, nor creating waste. Managing and measuring the flow is the act of analyzing exactly how smoothly these two routines are impacting your flow, and looking at ways to improve it.
How is flow measured?
Daily stand-ups and Kanban boards
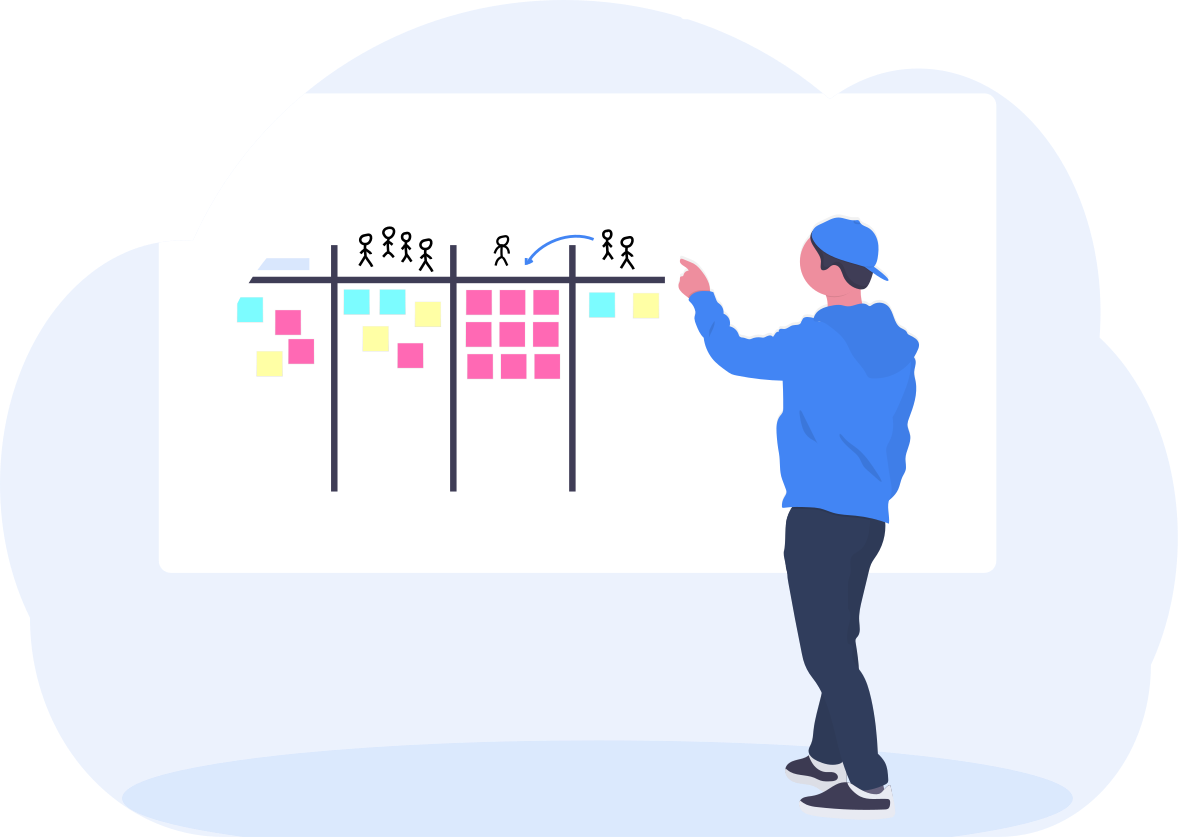
During the short stand-up meetings, team members view the Kanban board and observe how work moves from one stage to another - they analyze flow. It helps the team notice how long it takes for an item to move from one column to another, to check if similar items take comparable time to get done, or by how much it varies. Once you pay attention to whether items pause or get stuck in certain areas, and why - you can start thinking of what can be done to change that.
A fundamental truth about flow is that it’s not how fast an item moves through to a particular point, but how smoothly it moves from start to finish, that counts. Just like with rush hour traffic - it’s not important how fast your car travels over a short portion of the journey, what counts is your average speed over the length of the route. The more items flow stably across the process, the more predictable your results will become. And, the better you can deliver on promises to your clients, keeping them happy.
The focus of a dedicated Kanban stand-up session is the “anybody blocked” question - followed by “how can we help you?”. In other words, team members are looking for ways to improve flow. It ensures that everyone comes up with ideas and that you leverage the team’s collective brainpower, building unity, and a sense of empowerment within your organization.
Another aspect of watching the team activity on a Kanban board is optimizing the process itself. If the team notices steps, board columns, that are not adding to their productivity, or if they are aware of stages, adding which to the board would help them get more efficient, they should be taken into consideration immediately. Only a faithful representation of the process on the Kanban board stands a chance of benefiting the process and increasing its efficiency.
Did you know?
The Kanban Tool® online project boards make it easy for you to adjust the process flow at any time - also mid-process. They allow adding or removing columns and swimlanes (rows) without disturbing any ongoing work and tasks data. Use Kanban Tool® to keep your process forever open to adjustment for the better!
Cumulative flow diagram
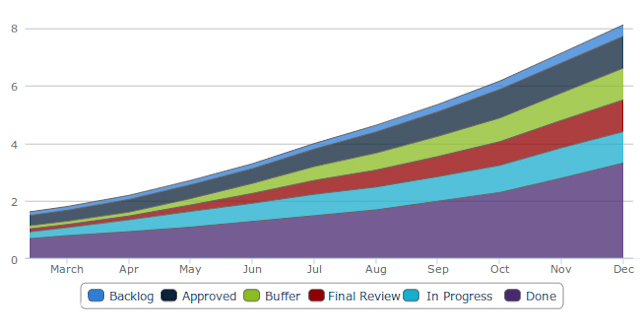
This metric shows the quantity of work in progress at each stage in the system. The smoothness of the CFD expresses how evenly and predictably your company operates. You should pay attention to how many items are blocked, and how quickly these bottlenecks are being resolved. What’s the length of time that it takes for items to move from one side to another - and, on average, are these times decreasing? Measuring and managing flow is done to decrease overall production time and to decrease variation, so that outcome predictability and performance are improved.

Lead & cycle time with throughput and WIP limits
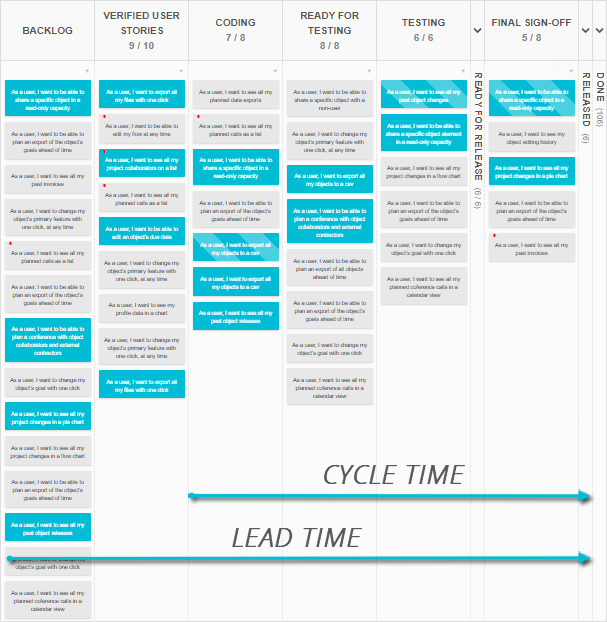
The lead & cycle time measurement concentrates on a comparison between the time items spend in the process on a whole - the lead time, to the time they are actively being worked on - cycle time. An analysis of these two values informs you of the process throughput: the time it takes to produce results.

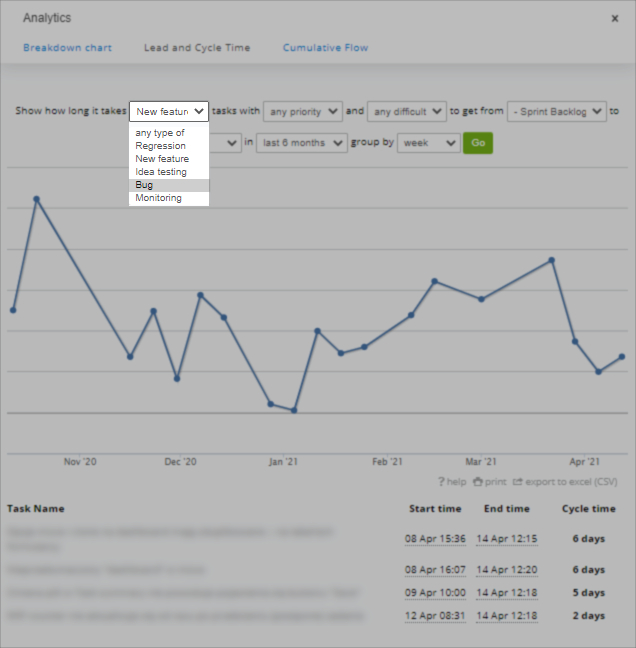
However, teams that work in knowledge-based domains, e.g. creatives, media producers, software developers, may have a hard time relying on the throughput metric, as individual work items can come in very different scopes and sizes. Coding a complex application feature will take a lot longer than fixing a minor bug in the same application. Therefore, those teams would be advised to create separate throughput readings for their various work types or to compromise and split larger items into unified-size bits. Given how cloud-based Kanban boards, e.g. Kanban Tool allow for generating the lead & cycle time reports separately for each work type, we believe that running separate analyses for each task type is the easier choice.

Another element that has an impact on flow are a team’s WIP limits. A team’s overall throughput will vary depending on how many (or few!) items they are allowed to take on at any given time. So it is entirely possible to alter the throughput by tweaking the allowed WIP tasks value. Still, be careful when changing the WIP limits – do it rarely and based on past workflow analysis, not arbitrary guesses.
It’s worth noting, that limits should apply to most stages of the flow – with the inclusion of the “waiting” columns. This is due to how the cumulative queuing time across all stages impacts your team’s final throughput. In many cases, addressing these queuing stages by actively working on how quickly items are picked up from them, is the fastest way to shorten the cycle time.
As we explained in this article, WIP limits are crucial in identifying and solving bottlenecks – which in and of themselves – are the opposite of a productive flow.
Direct flow efficiency metric
The same two data points used in throughput measurement — lead time and cycle time — can also benefit mature Kanban systems through an explicit flow efficiency metric. Analyzing fluctuations in this value over time can help identify and visualize inefficiency patterns. You can learn more about it here.
Resolving bad practices
Example Imagine a memo arriving from a CEO’s office for a specific item in the process to be expedited, as it’s a critically important request from an important client, saying it needs doing ASAP and at whatever cost. The problem is, that there is often no measurement of the cost this exercise will have for the company. Measuring flow will highlight the impact of such proceeding, and show the knock-on effect. Leaders and the team will be able to see how other items get halted, and how much longer they will take to get completed because time was taken out to focus on the CEO’s pet project. Being able to show the CEO this data could prevent them from “expediting issues” in the future.
Engaging in flow management will increase your chances of improving the overall process instead of fire-fighting at the cost of skewing the entire operation and will – generally speaking – improve your process predictability. It will also mature your process, and help you understand that it is less important whether a project completes within an initial set time and if a set plan was executed. What matters more is that the entire system is calculable, allowing you to reliably forecast project completion for the clients and that it functions as intended, at minimal loss. That should let you focus on being a flexible and Agile company with clear goals, that it improves continuously, and where employees experience joy in their work.