What is Cycle Time?

Cycle time is a metric that measures how long it takes for an item to move from the “in-progress” column to the “done” column. It helps teams to determine jobs’ start and finish times, and hence their general delivery capability. A process’ cycle time calculates by dividing all the work-in-progress items by their average completion rate.
Why is cycle time important?
One of the most common questions stakeholders ask is: “how long will this take?”. And it is an important one. It helps them to determine costs and to best plan for their market. But having to answer the question often leads to frustration from the delivery teams and an answer along the lines of: “it will take as long as it takes”. Such a response does not allow clients to plan anything, and it shows a lack of efficiency on the delivery team side. The bottom line is: if delivery teams do not know how to provide this answer, customers will go to suppliers, who can.
Cycle time is critical not only to clients but suppliers as well. It is an accurate indicator of how well their business is doing. If a team’s cycle time varies - that information alone indicates underlying problems within the workflow or with the team competency itself.
How to calculate cycle time?
On a physical board, a team member would write the date and time of when an item moves from the “backlog” to the “in progress” column. This way, the cycle time measures once work on an item starts. After the task has traveled the length of the board, the team member would record the date and time of when it reached the “done” column.
To learn what the cycle time was for a given item, you’d use this calculation:

The optional addition of “1” corrects a potential “0-day” cycle time of those items that were completed on the same day that work on them got started.
Calculating your process’ average cycle time
Knowing an individual item’s cycle time after the fact isn’t of that much help in and of itself. The value in making this measurement is using it to predict the average cycle time for your process.
Teams that have been using Kanban in their operations for a while can forecast the cycle time by dividing the total work in progress number by the average completion rate.

where:

Example If there are ten items in progress, and - on average - it takes two weeks for the team to complete each item, then the total cycle time would be twenty weeks, with an average cycle time of two weeks, simple.
But what if there’s a variation in the items’ completion rate? Say, there are five tasks with {2, 2, 1, 3, 3} weeks cycle time each. Then, the total cycle time will be (2+2+1+3+3) = eleven weeks, with an average cycle time of 11/5 = 2.2 weeks.
Thanks to this information, when the client comes back with a project consisting of ten tasks, and you’ll want to forecast the completion time, you’d multiply the 2.2 weeks value times ten to get a twenty-two-week total cycle time.
It gives you a reliable way of communicating completion times to the client and enables you to offer them realistic commitments.
What does cycle time depend on? How to reduce it?
On the above calculation, we can see that the larger the count of “in progress” items, the longer the cycle time. That is one of the reasons why Kanban seeks to limit WIP. It is the quickest way to decrease cycle time.
Another way to do this is to, of course, speed up work. A significant help with that is ridding the process of bottlenecks and blockers, helping items to journey across the board quicker.
Did you know?
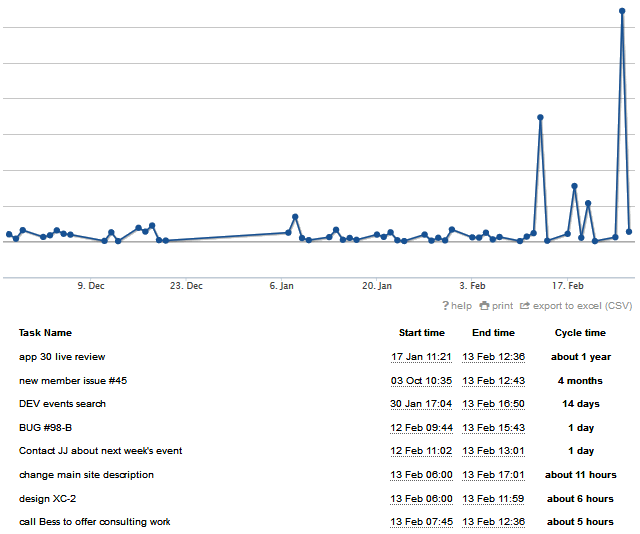
Kanban Tool® provides you with an automatically generated Lead & Cycle Time diagram, analyzing the speed of tasks processing on your project board. Make use of performance insights without doing any extra work - try the digital boards for free!
Advanced practices to improve the cycle time
Classifying items on the board can further help to decrease the cycle time. It relates to the variation in different classes of service’ cycle times. Coding a new feature will have a cycle time other than fixing a minor bug. Classifying items on your Kanban board will help you accurately estimate delivery times and come up with the best mixture of production tasks for the day, week, or Sprint.
Because cycle time is a measurement of time for a task moving from point A to point B, a Kanban team could have separate cycle times for various process steps, e.g., ready, coding, testing. Unless explicitly stated, cycle time is usually the number of hours or days between the “in-progress” column and the “done” column at the furthest end of the board.
The power of digital Kanban boards is in their automatic, accurate, and easy tracking of all cycle times valid for your process, as well as of various other statistics.
Example

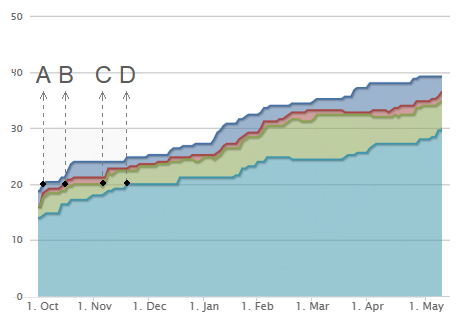
Visualization is a crucial component of Kanban, providing an easy way to grasp the process cycle time, also, in part, on the Cumulative Flow Diagram. The CFD shows the stability and predictability of work. Additionally, it lets the team calculate and report on cycle times, not only the overall speed of work processing.
Example

We can see that in October, there were 20 customer requests (blue area - letter A). Between October and November, the team worked on twenty requirements specifications (red area - letter B). Around the end of November, nearly twenty items have been completed in the requirements specification phase, and twenty tasks were in review (green area - letter C). And at the beginning of December, the team had twenty items completed (turquoise area - letter D). So, their total Cycle Time for twenty work items is about two months.
What are the key benefits of measuring cycle times?
- Having solid data on which to predict process completion
- Gaining a stakeholder/customer viewpoint on your process - making communication faster and more meaningful
- Having fluid access to your process’ speed and health, making you aware of any issues as and when they are happening.
