Visualizing the Workflow
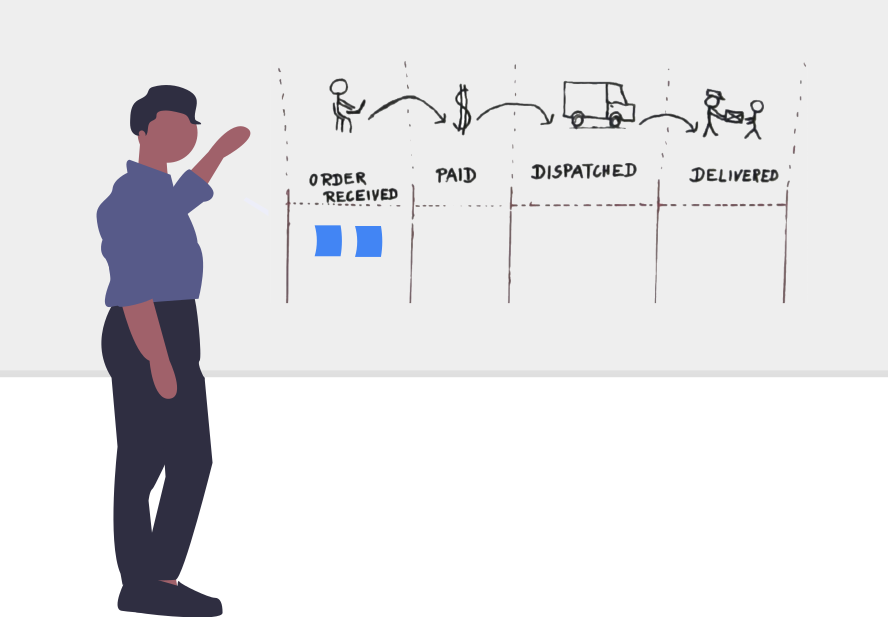
Workflow visualization is critical to a team’s success and is the most important aspect of the Kanban method. Arguably, the strongest reason why it makes an instant impact on a team is the transparency that it allows. With all work items visible on a shared board, everyone knows what’s there to be done, who is engaged in which task, and, potentially - depending on the board’s nature - when specific items are expected to be done.
The project manager experiences the very same benefit, from their perspective: they see what the resources are being spent on, what kind of work takes the bulk of a team’s time, and - crucially - they can spot process bottlenecks and address them.
There is also another reason why getting familiar with Kanban starts with process visualization: you need to get a good understanding of how you’re working now, find out the reasons why things are done in this specific fashion, to later be able to make informed decisions about how to improve.
How to visualize your workflow?
A workflow is the sequence of characteristic steps that tasks or products go through from the start of work to the finish. From a more abstract perspective, a workflow is also the act of real work items flowing through this sequence.
Humans process visual information much better than any other form of communication. In Kanban, visualization of workflow means mapping distinctive steps of work into columns of a Kanban board, and tracking work items as they move through them. You can visualize your process in just a few simple steps. You may get surprised, that even the simple act of naming all your process stages, can reveal facts about your workflow, that you were unaware of.
Step 1: Identify the value stream
Value-stream mapping is the process of naming the value-adding steps a team or a person does, to initiate and complete a piece of work. No matter the process, there will always be a list of activities that turn an item, document, or piece of raw material into a product, by performing actions that increase the material’s value.
The value stream provides clarity and creates a high-level how-to, making it easier to know what actions you should focus on, and which should be minimized, as they have no meaning to the end client, and hence do not increase your revenue, so should be seen as a waste.
Example
Let’s consider the value stream of building a chair. A carpenter would first buy a piece of wood. He would measure and cut it, then shape, glue, and assemble it, to finally paint and sell the piece. These steps would take a $5 piece of wood and increase its value to a $50 chair.

Step 2: Identify the scope of work
Once you know your value stream, you need to decide what part of it you have control over, want to focus on, and visualize on a Kanban board. If the value stream is your map, you now need to find and mark on it the path, that you travel the most on. A good choice would be the highly repetitive parts of your value stream, that engage specific groups of employees. The more narrow and uniform the group of people involved in the considered scope of work is, the simpler work management will be. Try not to include any process steps that this specific team has no say nor impact over, as that will only create uncertainty, confusion, and delay.
Example A value stream for a software development company may start with contract negotiations, followed by coding, and end on project documentation and handoff. Developers don’t need to know the status of work in the contract negotiation step. Also, the project handoff is a one-per-project event, while during coding, many repetitive cycles of feature implementation and testing take place. Given that, you may decide to focus on the coding part alone, and break it into a sequence of ‘Feature requested’ > ‘In coding’ > ‘In testing’ > ‘Finished’ steps, that every feature requested by a client should go through.
Step 3: Map the workflow stages to columns on a board
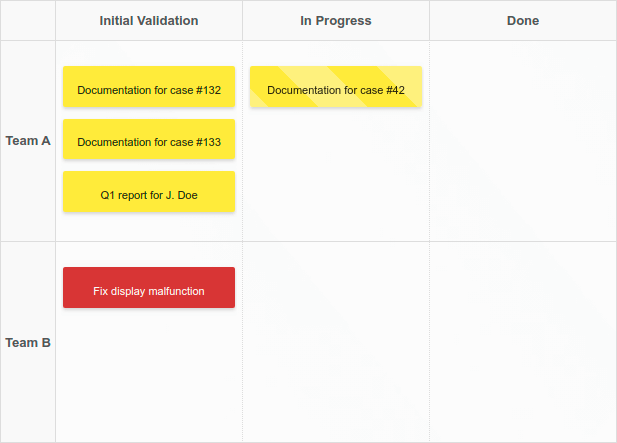
Once you identify the value stream and its scope, it’s time to make things visual. Get yourself a board - it may be a standard whiteboard, an electronic-style Kanban board, or just a place on a wall in your office. Then break it into columns - one column for each stage of the workflow, from left to right. Show the name of each stage at the top of the columns. If you have separate teams or projects, that run the same process, break the board horizontally to introduce swimlanes. You should end up with something that looks like this:
Example
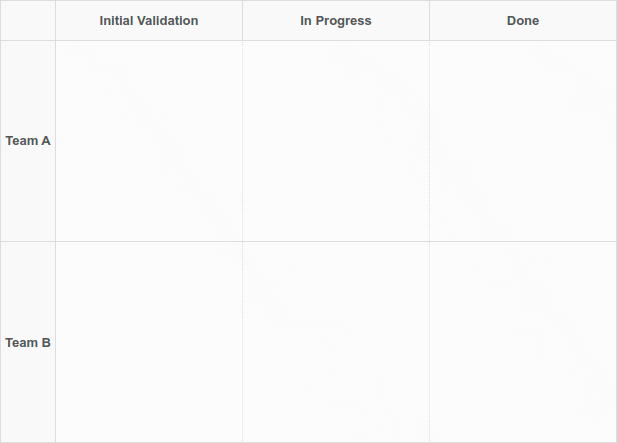
This is your first Kanban board - make sure to display it in a place where everyone involved can access it easily. A hallway in the office or an online platform are the usual choices. You’re almost ready to start placing work items - in the form of Kanban cards - on your board.
Step 4: Define types of work and what ‘done’ means for them
Once your Kanban board layout is ready, you need to define the types and classes of work items that will flow through it.
Are these physical products, generic tasks, or a mixture of both? What are the prerequisites for each category - do work items need to be preliminary approved or follow set standards? Also, for the process stages where a hand-off of work happens - and the final stage in particular - define what conditions each type of work should meet before it can be considered done.
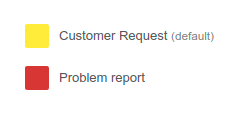
After you’ve identified these, assign a color to each type of work to make their differences visual, and be sure to let the team know what each color means, and what are your definitions of done work.
Example In most cases, software development teams will be dealing with two types of work - “Customer Requests” and “Problem Reports”. Customer Requests will be shown on yellow cards and should only come directly from the customer. Red cards will represent Problem Reports and may come either from the customer or from the internal team. For both of them, ‘done’ means that a request has been completed, and no complaints have appeared for 15 days.
Step 5: Decide on a card template for each type of work
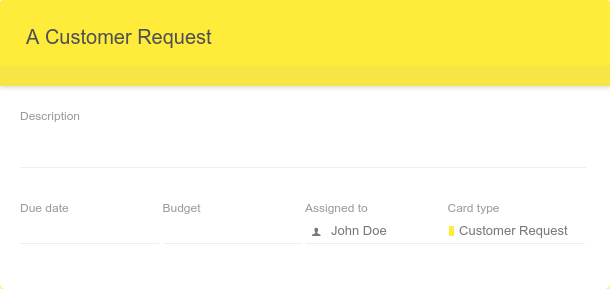
Next, for each type of work, decide what information is essential and should be expected on a card. Kanban boards are highly visual, and apart from using card colors, it’s good to have different card templates for various kinds of work, that highlight and facilitate sharing and reporting of relevant information.
Example You may decide that for “Customer requests” important information would be a copy of the original request, expected due date, and budget. At the same time, for “Problem Reports” this may be a detailed description of the problem with a list of steps to reproduce it, and information on how many people reported it.
Step 6: Place work items on Kanban cards
You should now know the colors and formats of cards, so start visualizing your work. Get a bunch of colorful cards, format them the way you like, and fill them with tasks - each on a separate card.
Now, pin the cards into relevant columns of the board, according to the stage of work they’re currently in. Inside of individual columns, order cards according to their priority - the most urgent card should go at the top, followed by the second most urgent one, and so on. Such ordering solves the problem with classical prioritization - “if everything is urgent, then nothing is”.
Example
Step 7: Track the flow of work and review the process periodically
Tracking the status of work items as they move through the process will allow everyone to see bottlenecks, blockages, and spot places where the team is over-committed. That’s why it is crucial to keep the board where everyone can see it. Open access to the Kanban board will foster good team communication and make everyone aware of each other’s responsibilities and availability.
Make sure to also keep an eye on any changes to the process that incrementally creep in. For the board to remain a valid tool of help, it needs to be accurate, so when the process gets modified, show that on the board. Keep the visualization true to the process at all times, to offer the best available help to the team, and ease their work rather than have the board become another meaningless to-do for the management’s sake.
Did you know?
Kanban Tool® takes workflow visualization very seriously, with numerous features dedicated to optimizing the ease of data perception at a single glance. Discover a better way of looking at your work.
Outside of process and status transparency, easier communication, timely bottlenecks identification, and an insight into potential flow improvement areas, visualizing how teams and individuals work also creates a tangible and replicable record of approaching given project types. This can significantly decrease the time required for planning new endeavors, and make them easier, thanks to available past templates.
Understanding how powerful a tool visualization of your workflow can be, you may be tempted to halt your Kanban implementation here (some teams do), but by doing so, you might miss out on several further advantages that the method brings. Please review the rest of Kanban Fundamentals to learn more.
