What is Lean Value Stream Mapping (VSM)?

In Lean thinking, few tools are as deceptively simple and as strategically revealing as Value Stream Mapping. Though sometimes mistaken for a process diagram, VSM is neither a quick operations sketch nor a visual prop for executive meetings - it’s a surgically precise diagnostic tool for dissecting organizational value delivery and exposing inefficiencies to catalyze data-driven transformation.
What Lean Value Stream Mapping does
Fundamentally, Value Stream Mapping captures the lifecycle of a product or service from order to delivery, with an emphasis on where value is added, from the customer’s perspective. In Lean terms, value is not what the organization thinks is significant, but what the customer is paying for, explicitly or implicitly.
VSM encompasses all the steps involved in production or service delivery, as well as the timing, queues, hand-offs, batch sizes, delays, and the flow of information, all of which usually evade scrutiny. This approach forces organizations to face the gap between assumed efficiency and actual throughput.
Common misuse of mapping
A typical organization already has diagrams of its processes, which are usually clean, logical, and somewhat hopeful, if not naive. What it probably doesn’t have is a map of reality: Lean VSM is an exercise in surfacing all the existing process friction points that conventional mapping may conceal.

The easily made mistake is believing that having a process map is sufficient. Yet traditional process maps usually omit wait times, rework frequency, and the way communication cascades, or breaks, across departments. In contrast, correctly applied Value Stream Mapping includes all of these.
And it will only be possible to improve a process flow, whose current flaws and pain points we are aware of. An organization must draw its current state VSM to plan a better one for the future.
VSM for seeing the invisible
Drawing a Value Stream Map begins with a Gemba walk: directly observing the spot where value is created or dropped. Relying on SOP documentation and interviews alone isn’t enough, a VSM team must follow the path of the product, observe work, note communication and blocker patterns, and track all delays.
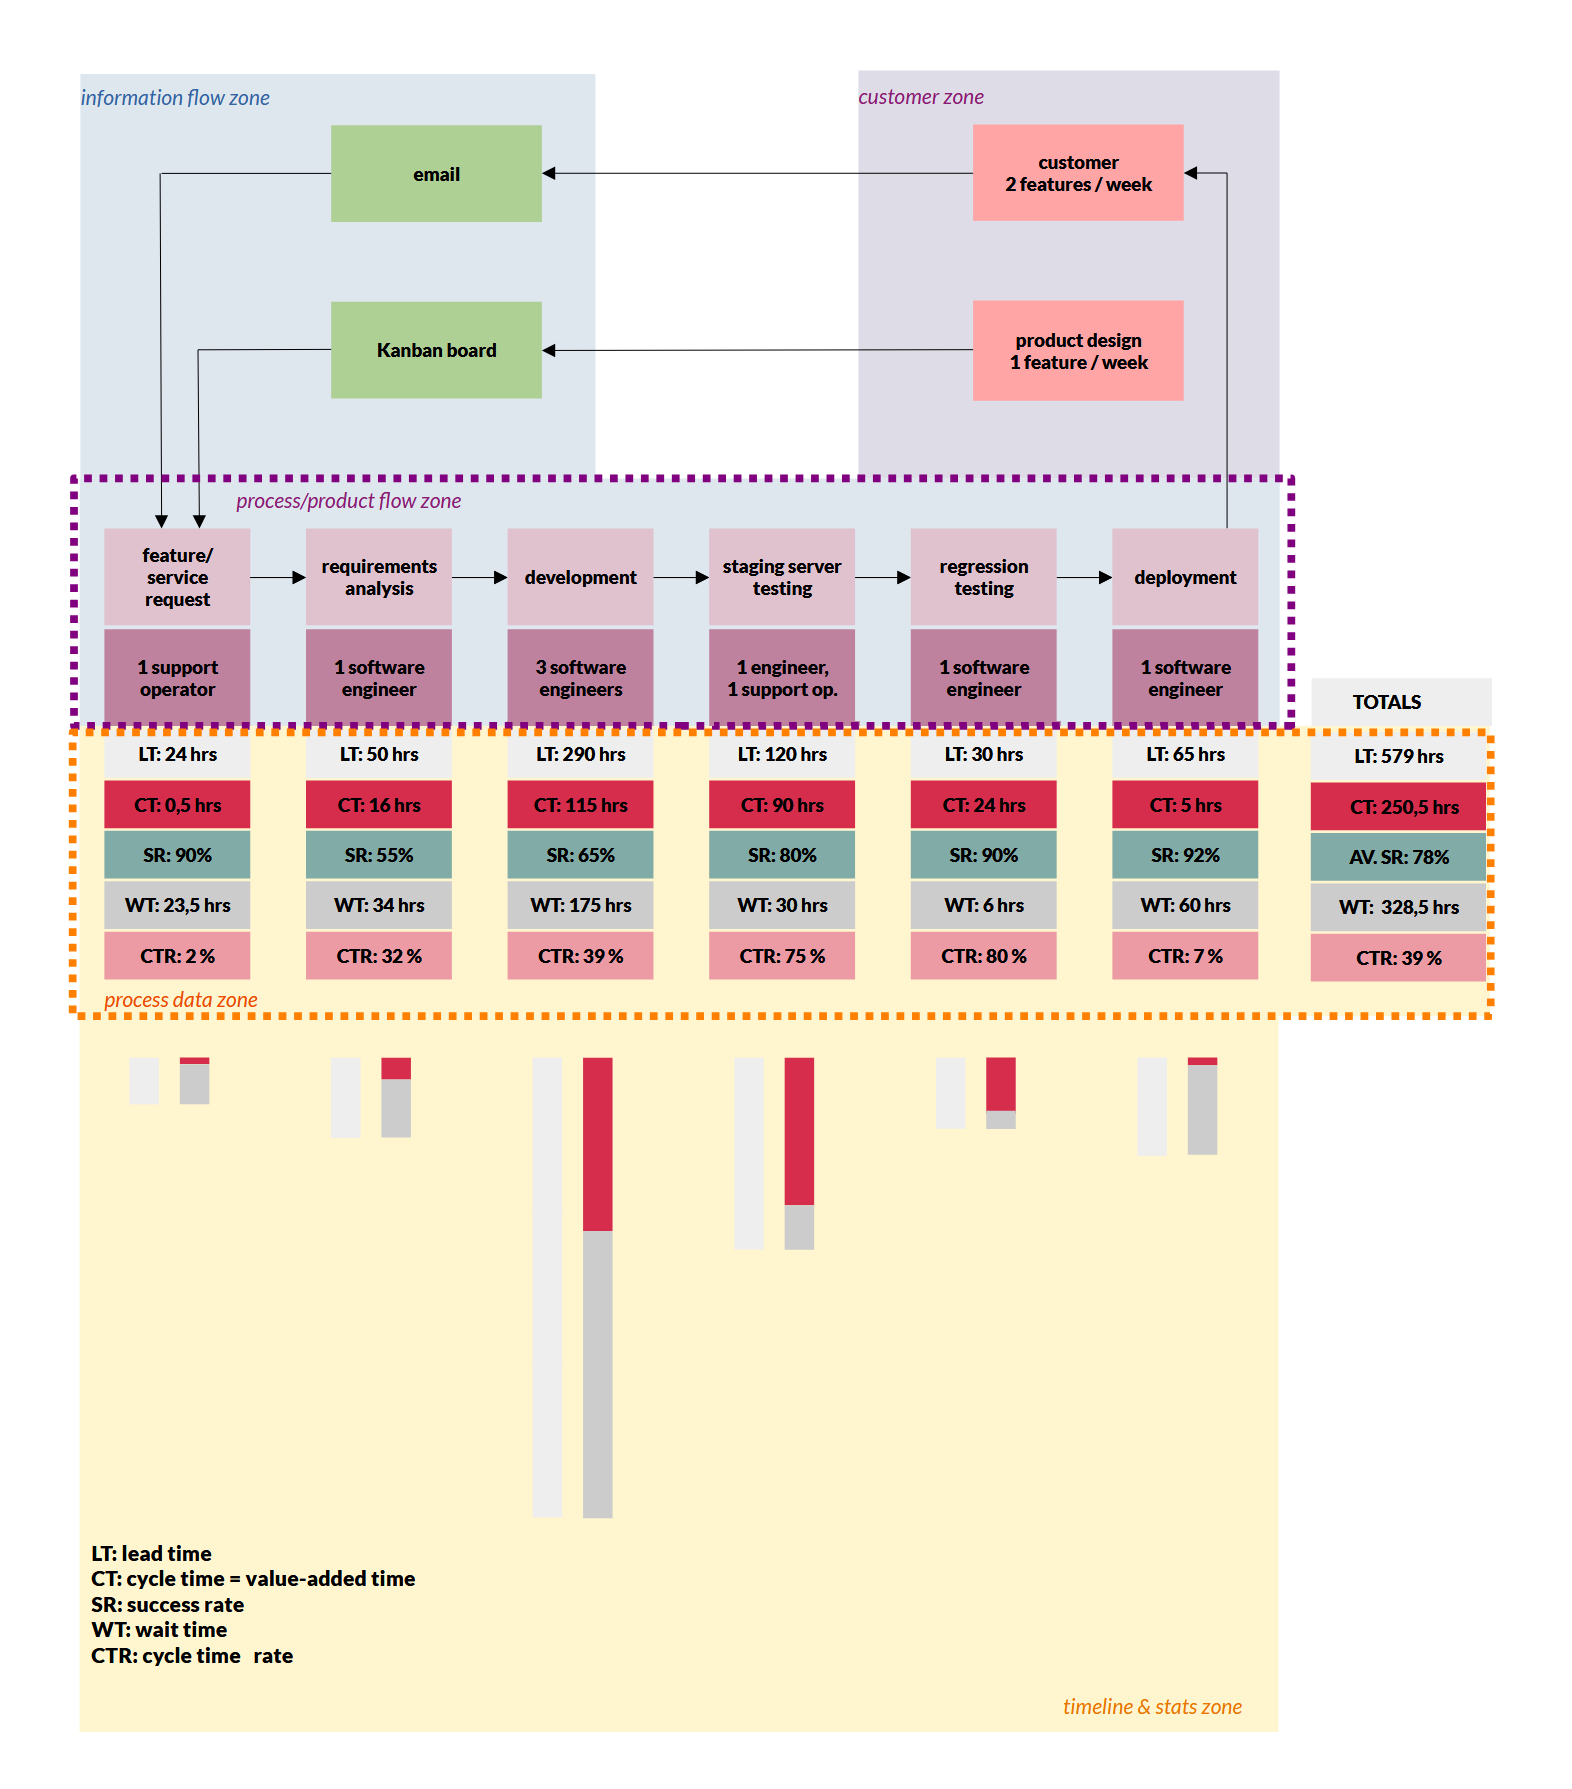
An information-packed value stream map goes beyond a linear sequence of steps, taking the shape of a layered, or zoned, analysis.
How to visualize a Value Stream?
A Value Stream Map should be constructed layer by layer from firsthand observation and collected data, together with candid cross-functional input. The purpose of visualizing a value stream is to move from assumptions to proof and to reduce vague complexity to actionable insights.

To achieve an informative map without giving into chaos, it’s common practice to use VSM zoning. Through these zones, the chaos of process mapping morphs into a well-defined structure, with each zone representing an analytical layer separating different dimensions of the system behavior: physical flow, information flow, control, and decision points. Without zones, a value stream map is at risk of becoming an incomprehensible tangle of information; with them, it can be an x-ray of your operations.
It’s helpful to distinguish four core zones, placed top-down on the VS map:
1. Customer/supplier information zone
What it shows:
The zone frames the map, showing supplier inputs on the left and customer demand on the right. The demand is expressed in takt time, delivery cadence, and order mechanisms.
Why it matters:
VS mapping begins and ends with the customer, and this zone provides context for everything else. Any misalignment that arises between what customers want and how the organization responds often originates here.
Questions this zone answers:
- What is the customer demand rate?
- How often do customers pull products or services?
- How do orders and requirements enter the system?
- What’s the frequency of supplies delivery?
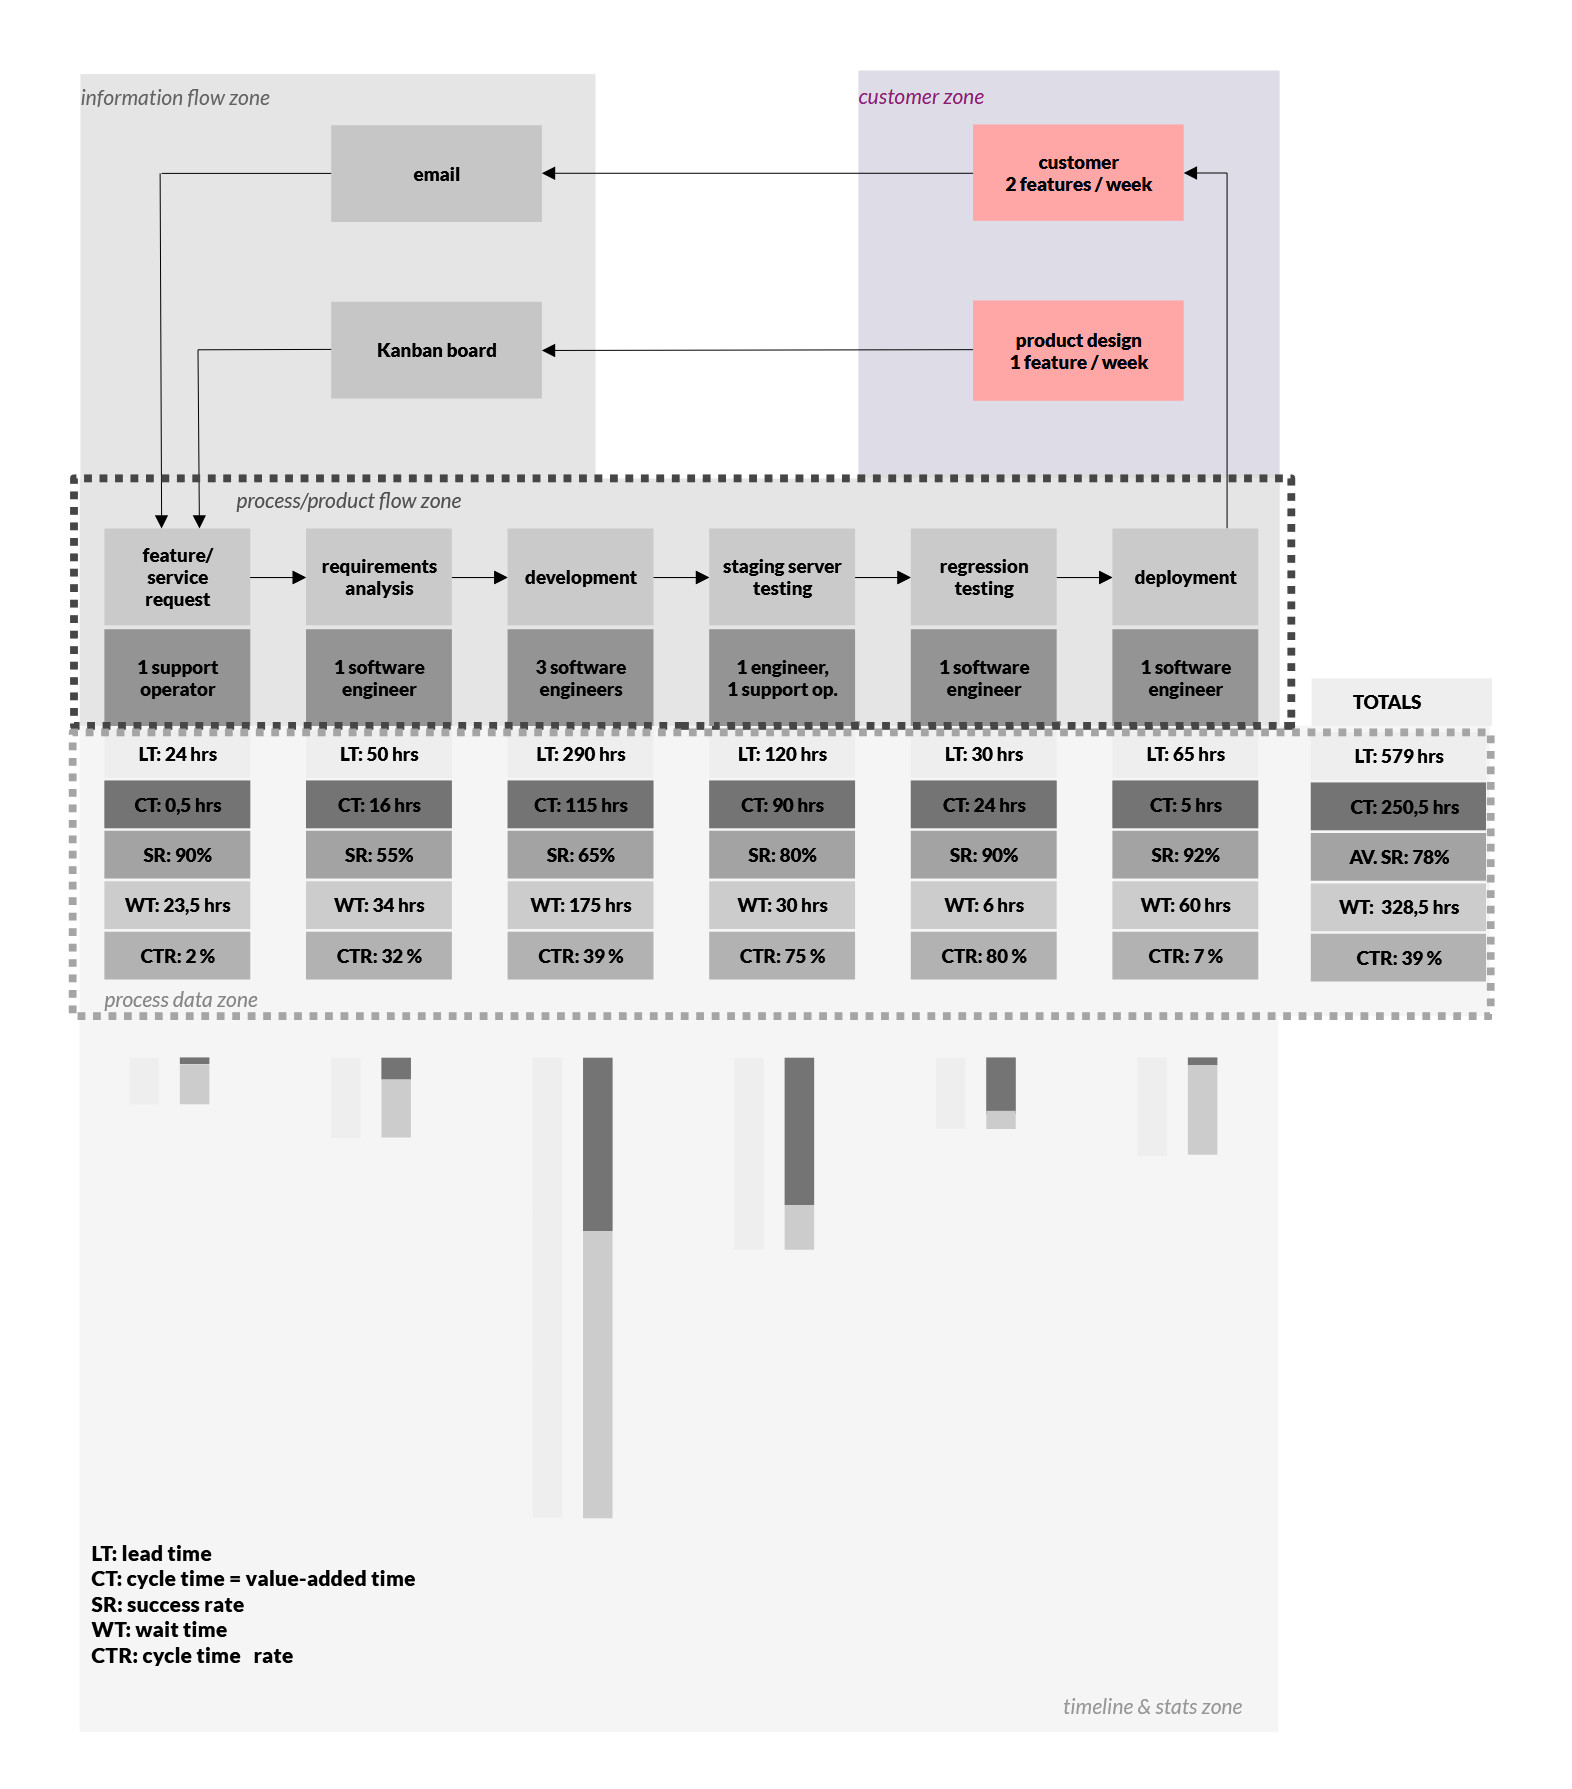
2. Information flow zone
What it shows:
It’s the nervous system of your operation, visualizing how work is triggered and managed: resource assignments, Kanban signals, email workflows, scheduling decisions, etc.
Why it matters:
Many process flow breakdowns result from informational congestion rather than physical issues. Insufficient signaling, relying on manual workarounds, or disconnected systems all create downstream chaos and delays.
Typical elements to capture:
- Scheduling logic: push/pull
- Planning systems: ERP, MRP, Kanban
- Decision nodes: who decides what at which point in the process
- Communication modes: manual vs. automated
Did you know?
A clear and accessible way to visualize the flow of information throughout the value-stream-mapped process is by using a customized Kanban Tool® board.
The board can represent information transfers as task cards moving across work-stage columns, making it easy to share with all stakeholders.
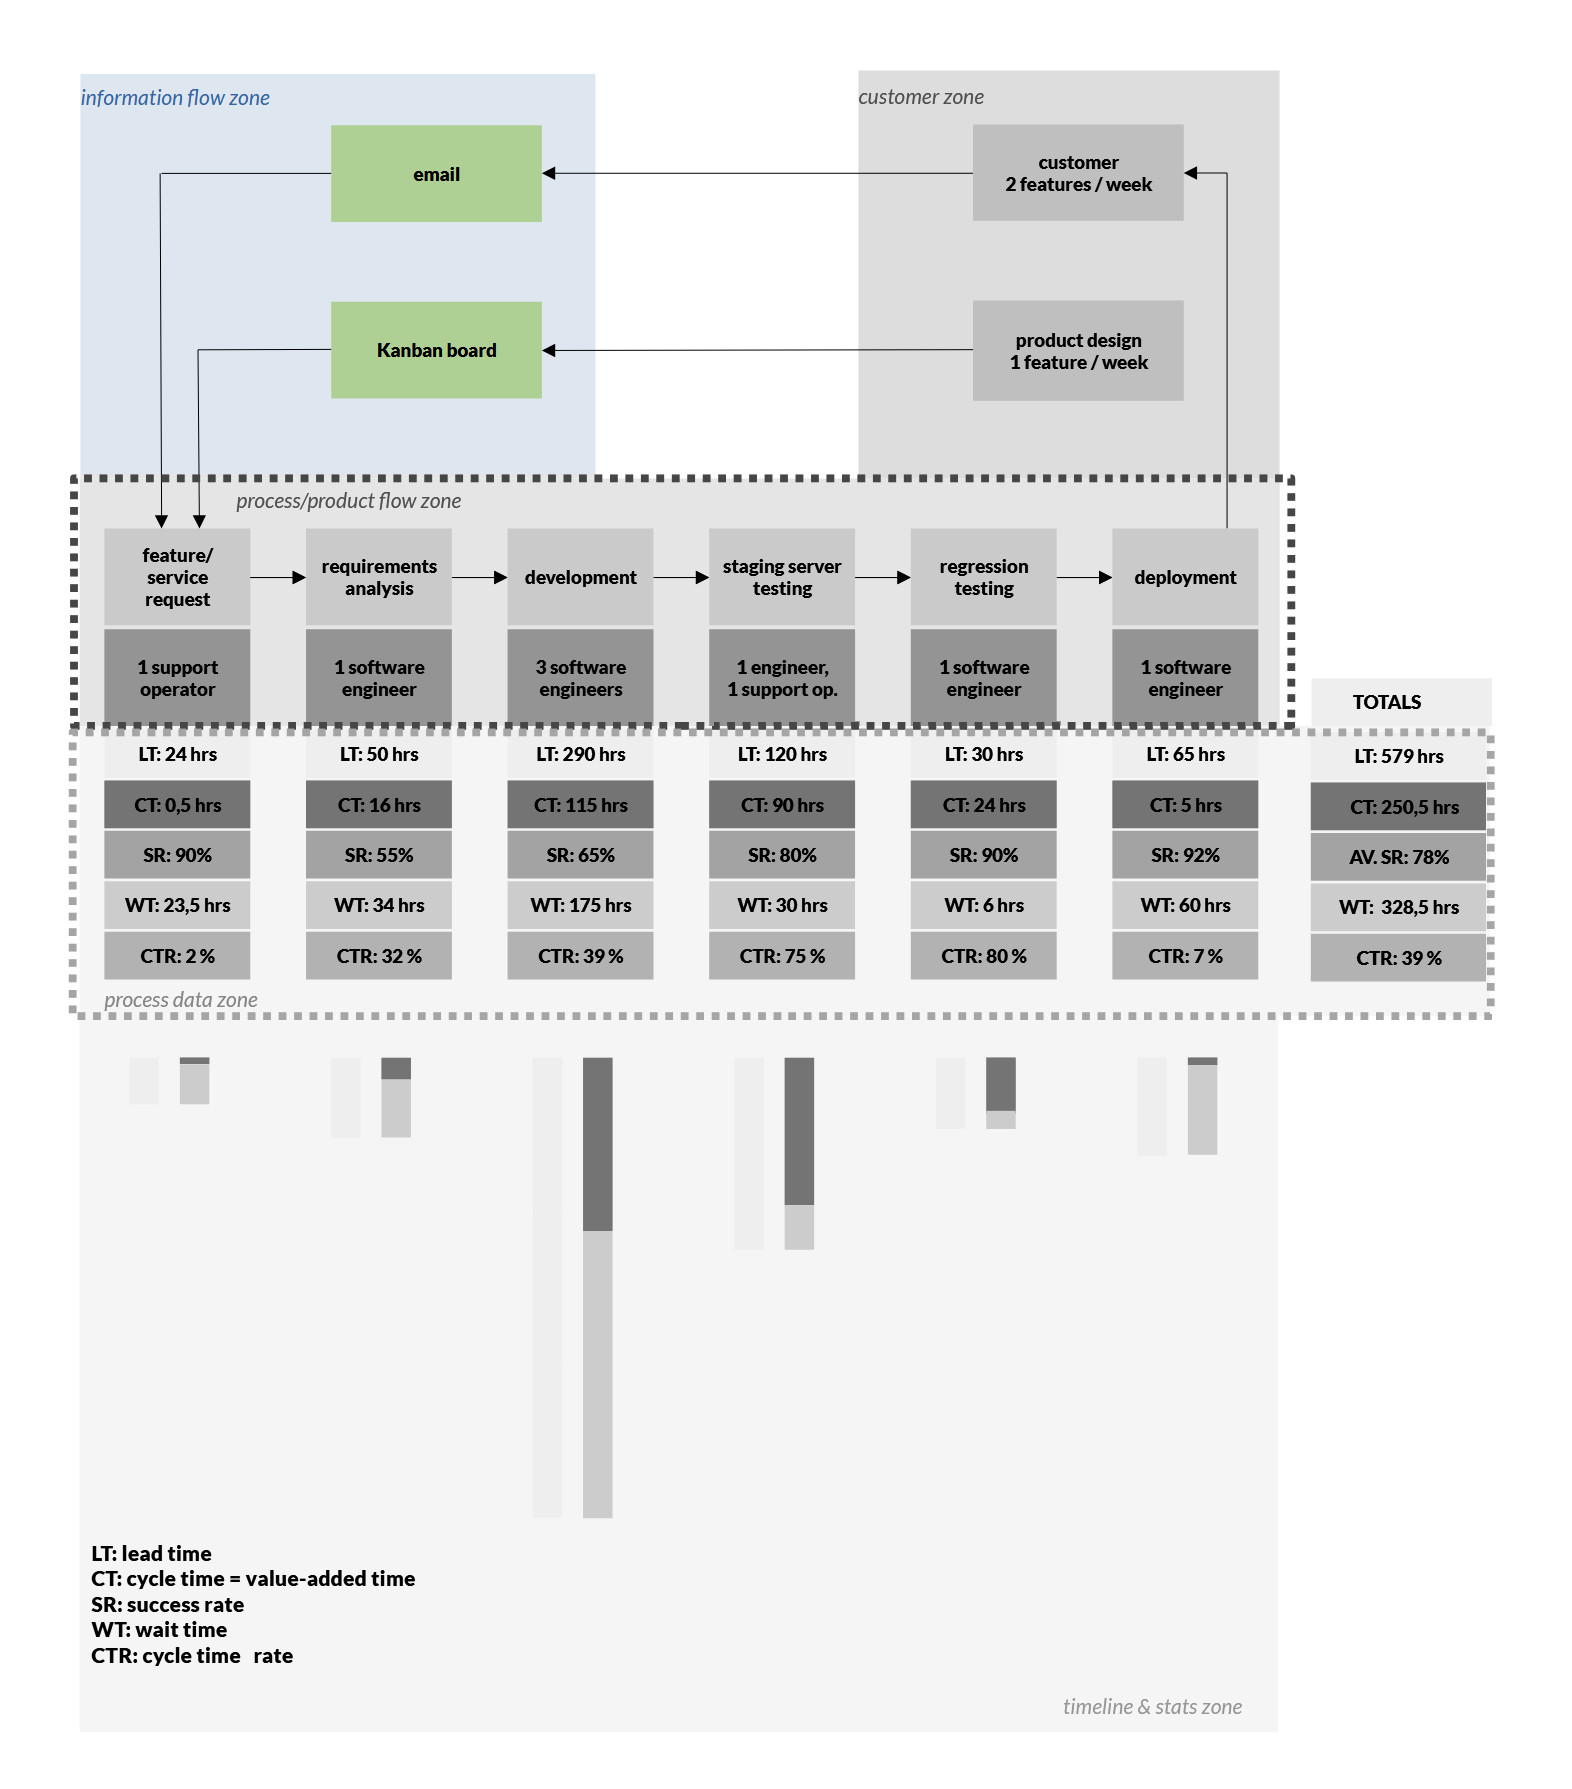
3. Process boxes with product/material flow zone
What it shows:
Illustrating the operational spine of the process, this zone shows a box for each process step, e.g., manufacturing, testing, triage, or development. Every box should include performance metrics such as cycle time, uptime, changeover, wait times, and accuracy rates.
For knowledge-based flows, process steps will typically correspond to the moves of task cards that document the work. In a manufacturing scenario, a separate zone for material flow may be beneficial just below the process flow, showing inventory changes, transport points, or batch movement indicators.
Why it matters:
This zone is where value is either added or squandered. Here’s where you may discover harsh flow truths such as that out of a 14-day lead time, only 2 hours were the active, productive work.
It is also where frictions lie: excess batching, queues, delays, or transport waste. It’s the VS map’s window into muda (waste).
Typical elements to capture:
- Inventory buffers
- FIFO lanes and batch indicators
- Transport delays
- Hand-off points
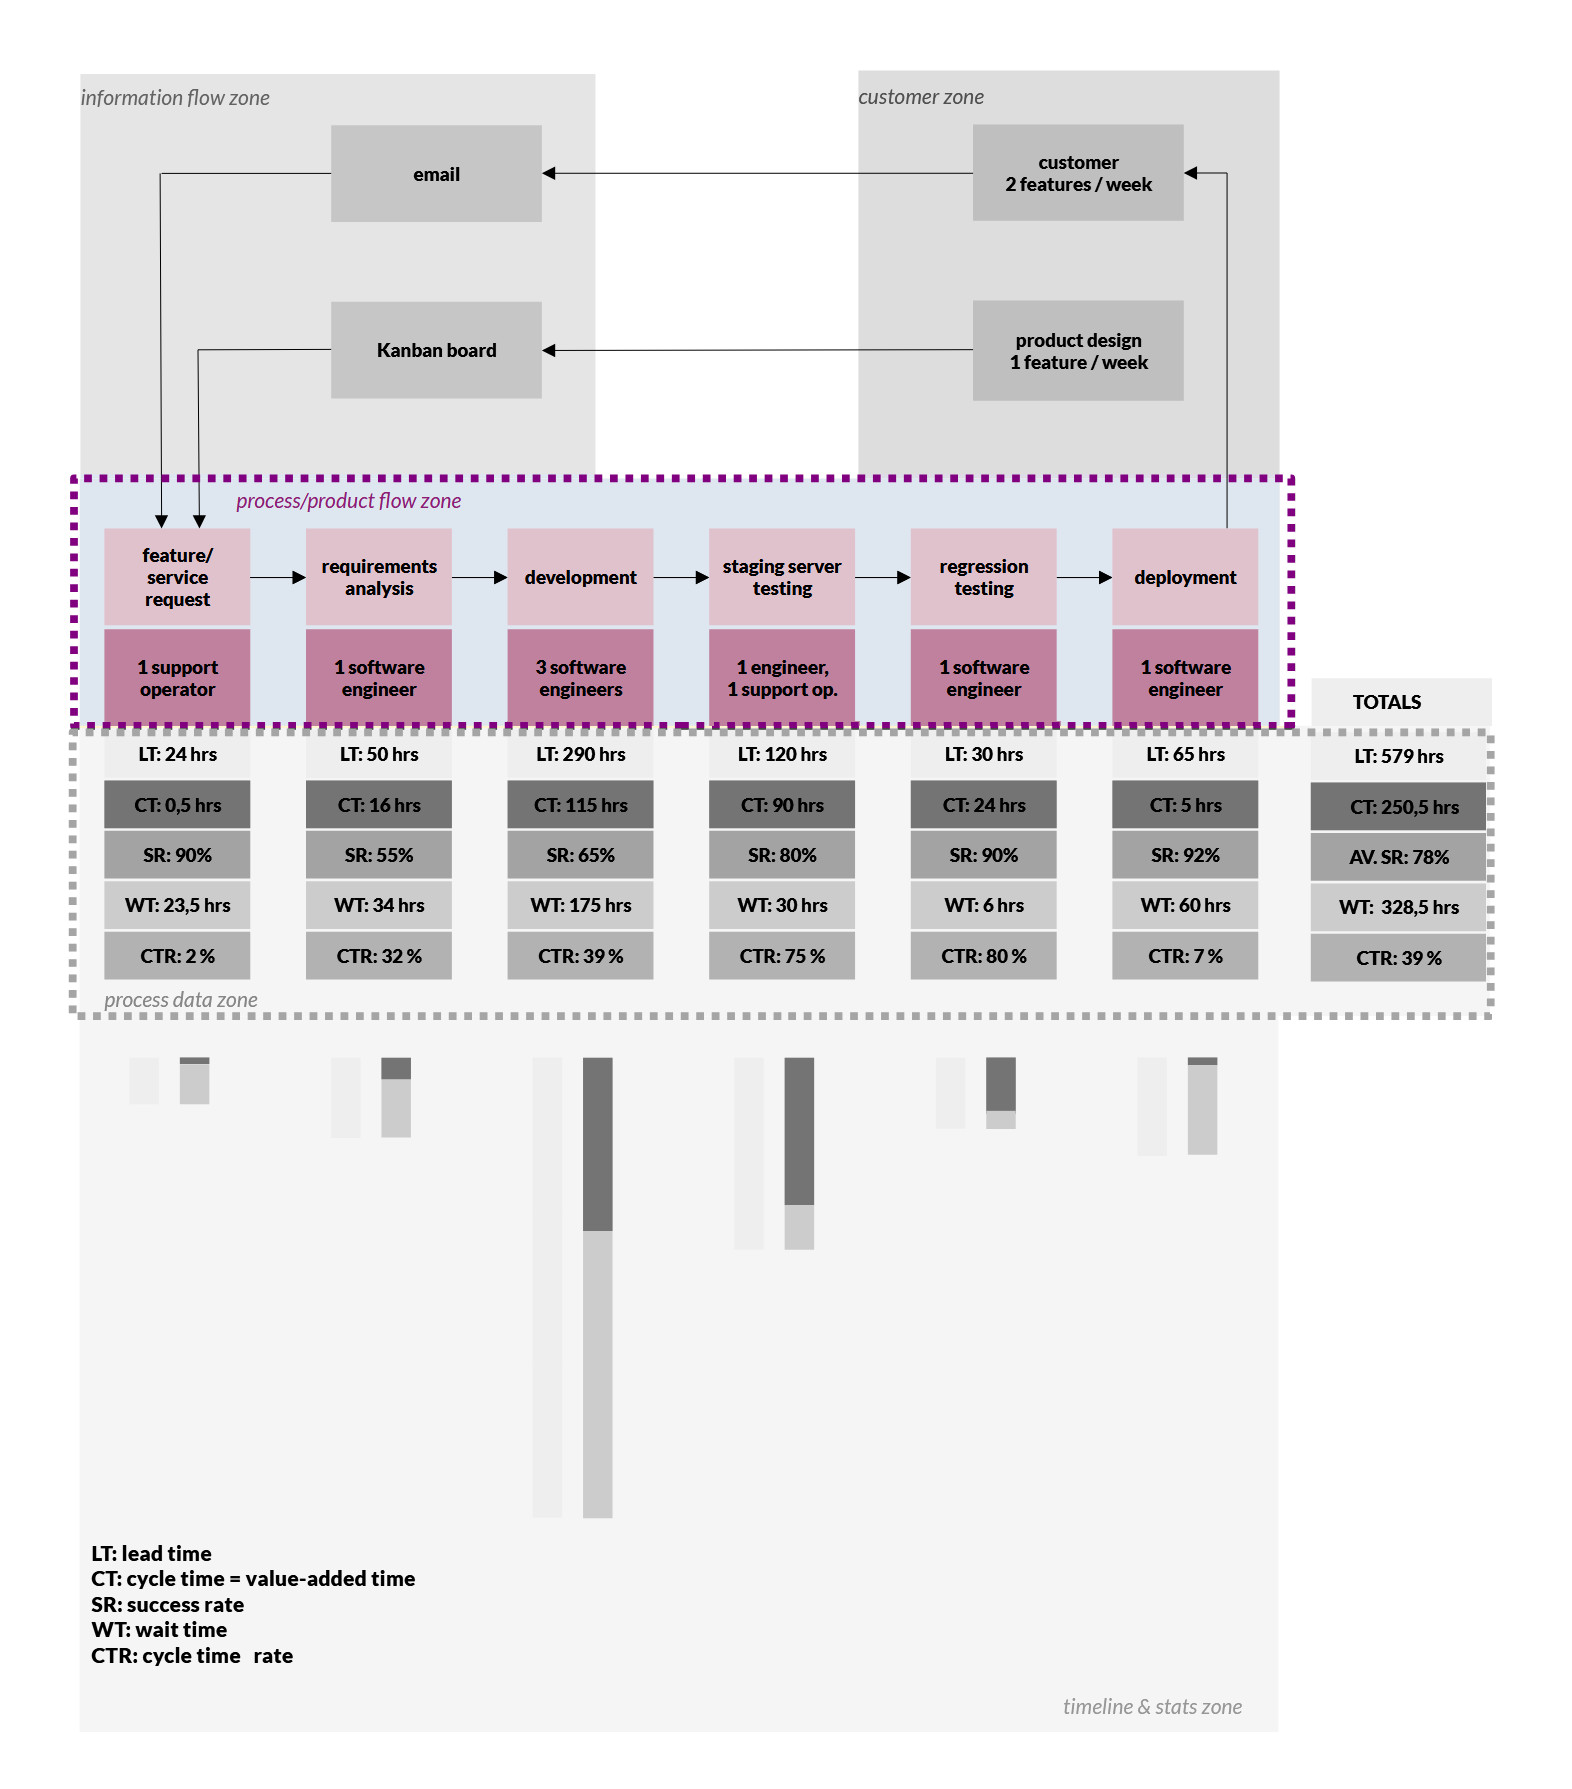
4. Timeline zone
What it shows:
As the summary layer, it breaks down value-added time versus total lead time, with their ratio uncovering the truth about an organization’s process efficiency.
Why it matters:
With the zone revealing the cumulative effect of delays, hand-offs, miscommunication, and inefficiencies in stark, numeric terms, here is where executives pay the most attention.
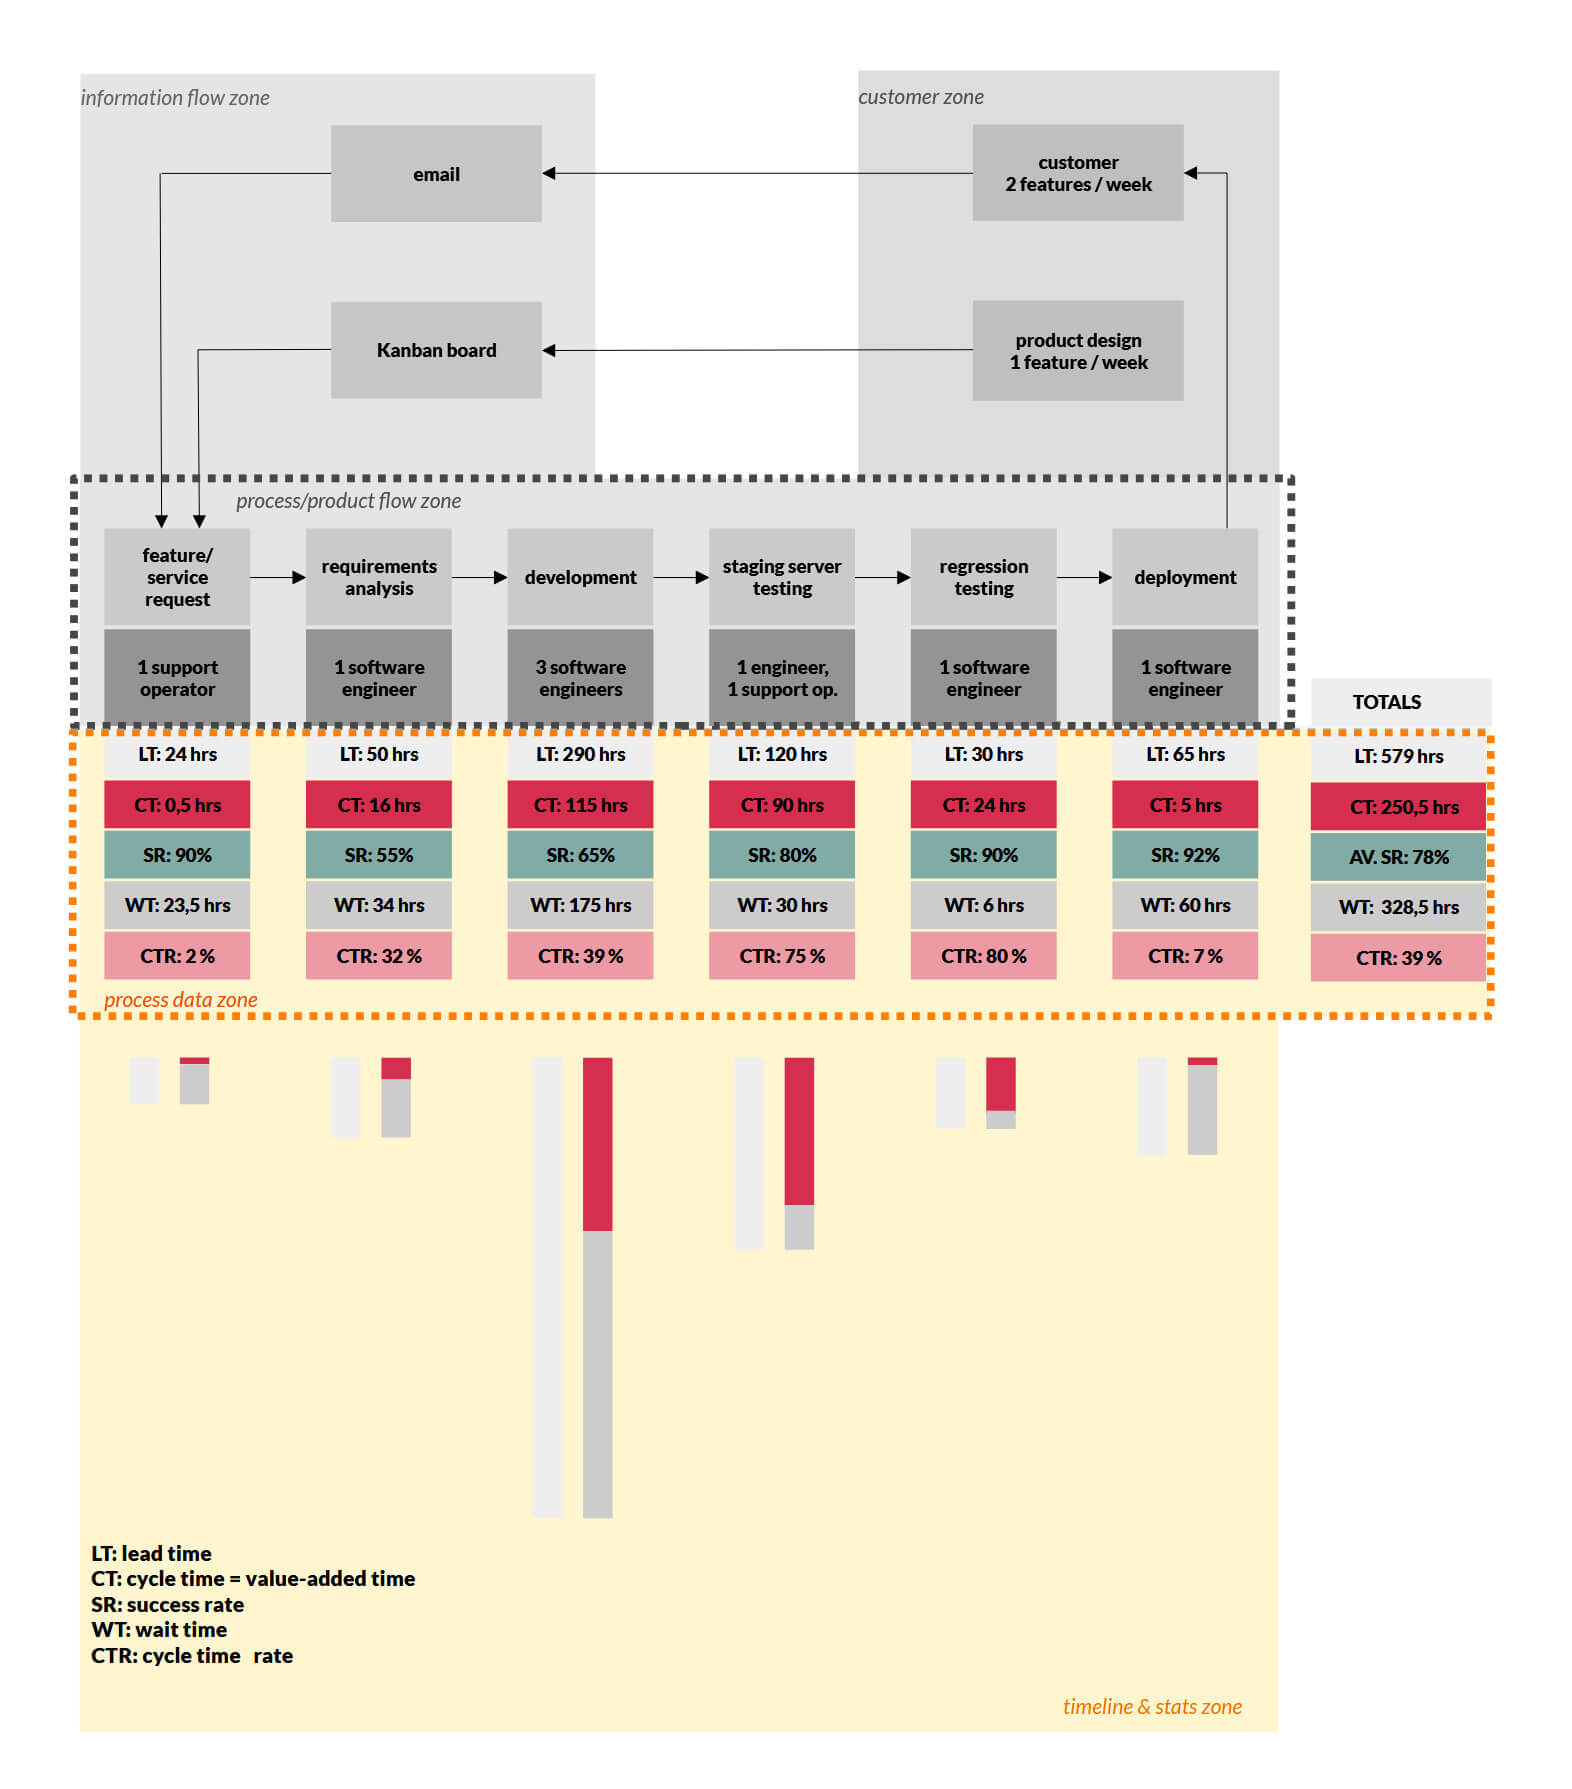
To effectively map the Value Stream, we recommend following a few rudimentary rules:
- Start with the present state: Mapping how things happen now, not how you think they ideally should proceed.
- Utilize standardized Lean system symbols to facilitate a shared visual language. The most common symbols include process boxes, data boxes, inventory triangles, timelines, and arrows.
- Keep zones visually aligned to ensure map readability.
- Quantify everything you can; keep away from vague terms in favor of solid measurements: days, minutes, frequencies, batch sizes, defect rates.
- Make the map accessible: Use whiteboards, sticky notes, or paper maps posted in the workspace. Doing that encourages collaboration and keeps the team engaged.
The strength in perceiving the zones as a collective
While each zone tells part of the story, together they create a system-level view:
- Does customer demand align with scheduling?
- Does the information flow support or hinder execution?
- Is material flow in sync with process capability?
- Where do signals, and the flow, break down?

Mapping these vertical interactions can surface misalignment that would otherwise remain buried. It fosters the kind of cross-functional conversation among planning, IT, operations, and procurement that is rare to develop organically.
The real output: An optimized future state
While necessary to begin with, the current state map is not the culmination of the mapping process, your goal is creating a future state map. Instead of settling on wishful thinking, your organization’s future state VS map can be a structured process re-imagining, grounded in Lean principles: using pull systems instead of push, running limited-piece flow instead of batching, pacing to takt time, and eliminating as many non-value-adding steps as possible.
Notably, a desirable future state map doesn’t aim for perfection but targets a meaningful improvement cycle, often aligned to a 90-day implementation window. Pacing the change helps to avoid the paralysis of over-design and favors incremental, measurable gains.
Why do organizations resist Value Stream Mapping?
Just like most Lean techniques, VSM requires cultural readiness in the form of cross-functional transparency. Departments accustomed to optimizing their KPIs feel threatened by exposure to the broader system, particularly the risk of it revealing that departmental efficiencies come at the cost of global performance.
Moreover, Value Stream Mapping uncovers the real cost of misalignment. For example, a software development team releasing features faster than customer support can absorb them is not a mark of innovation, but waste. Raw truths like this can be hard to accept.
Lean spans beyond manufacturing
Developed for a factory context - TPS, specifically - Value Stream Mapping, just as Lean itself, has since proven valuable in knowledge-based work, e.g., healthcare, logistics, finance, and software development.
In software, mapping the flow from feature conception to delivery often uncovers information flow challenges, excessive hand-offs, unexplained wait times, unclear requirements, and testing bottlenecks.
In healthcare, hospitals were shown to reduce patient wait times by redesigning everything from triage to discharge with VSM.
These examples show that the domain of application is less important than the logic and discipline of process mapping.
How to do VSM right?
Mapping your process value stream effectively requires perspective: you must be comfortable with challenging assumptions, questioning long-standing, rigid practices, and involving all layers of the organization. A map created solely by managers without team member input will be incomplete, or false. Likewise, a bottom-up map with no leadership support will simply stall in implementation.
The value-stream mapping process also demands rigor: time measurements should be based on actual past work times, rework rates have to be verified, and so on. What’s more, as with all Lean practices, the team must revisit their VS map whenever changes are made, using it as a real-time artifact, not a one-time document.

VSM doesn’t solve inefficiency but can tell you where it originates
Of course, Lean Value Stream Mapping is not a panacea for your process issues. It is, however, a very sharp instrument with which you can begin to fix it. It offers your organization unparalleled clarity - an unflinching look at how work flows and where it falters. Provided that you are ready to trade an illusion of efficiency for data-backed transformation, VSM is essential.
When done right, Value Stream Mapping goes beyond a process map and becomes a mirror. The only question is whether your organization is open to face the reflection.
Further reading
VSM introduction & method:
- Learning to See: Value Stream Mapping to Add Value and Eliminate MUDA (BOOK)
- Value Stream Mapping: How to Visualize Work and Align Leadership for Organizational Transformation (BOOK)
- Creating Mixed Model Value Streams: Practical Lean Techniques for Building to Demand (BOOK)
VSM in IT & software development:
