How do Flowcharts Work?

Flowcharts are part of the process map family. The process mapping technique was invented in the late 1800s by Frank Bunker Gilbert, an industrial engineer.
Value stream maps tend to describe the core set of principles driving the supplier-customer flow in a birds-eye view, expressed as capacity, lead times, etc. Flowcharts, on the other hand, describe the sequence of steps with a defined context, e.g., a quality assurance, a software routine, etc.
You can think of flowcharts as advanced step-by-step diagrams to approaching a problem, a task, a process, a system, or as algorithms.
In Lean and Six Sigma, flowcharts depict process actions and decisions along with the order they’re required to happen in to achieve an end product. Charts represent actions as different shapes that flow from top to bottom or left to right, with the occasional use of swimlanes (rows), representing various responsibilities. The use of icons makes flowcharts more concise than a written narrative, and it often helps to transcend language and other communication barriers.
Why use flowcharts?
Lean’s fundamental routine is to visualize work. Doing that in a flowchart makes for a better understanding of what is coming next in the process. It helps to identify bottlenecks and potential rework areas - both of which can decrease the total value to customers and increase waste.
Did you know?
Another clever way to identify process bottlenecks is visualizing the process on a Kanban Tool® board. With all work items represented as cards in the completion stage indicating columns, you will immediately see which steps get blocked and need improvement.
Flowcharts are used in Lean not only to model the present - also to find improvement opportunities. Having an as-is chart and mapping a future state can help convey the changes that will need to occur and the improvements that will follow. Flowcharts are convenient in every phase of a Lean project lifecycle: Define, Measure, Analyze, Improve, and Control.
Flowcharts can also work as validators or toll gates in your company. If the team wants to change or update a process, leaders could request that one of the outputs is an updated flowchart depicting the benefits and changes that would transpire with the new process approval.
What symbols are used in flowcharts?
-
Process - the most commonly used symbol in flowcharts, denotes an action within the process. It signals that there is some form of work occurring here. It often contains a title for that specific work.

-
Subprocess - used for a procedure that is already documented somewhere else. It informs team members that more than one step is occurring here and that the complete steps are documented somewhere else - under another process map or a standard operating procedure. You should only use it if the subprocess it refers to has been documented.

-
Decision - it marks a point in a process at which a decision needs making. Typically, the decision revolves around a go/no go choice, approval of one thing or another, such as verification of a condition or a situational branching of the process.

-
Terminator - marks where the process begins and ends. Especially useful when a flowchart spans multiple pages. The terminator shape is sometimes inclusive of a trigger that starts the rest of the process.

-
Preparation - a hexagon indicates that a step in the process prepares for something else. An example would be the deployment of a new software package before it can be tested.

-
Manual Operation - specifically handy where most of the actions are automated or electronic. E.g., in motor vehicle manufacturing, to show which part of the line is operated by humans and which by robots. Remember, in Lean, we are happy with machines waiting on humans but not the other way around.

-
Delay - points to where a waiting time occurs. The shape can help you identify potential waste in your process, e.g., stemming from batch sizing or bottlenecks building upstream from this stage.

-
Connector - marks a jump from one process to another. It’s used to indicate that an inspection has occurred and requires including a part of another process.

-
Document & Multi-Document - show that a step in your flow will create a document or multiple documents, e.g., as part of a batch process.

-
Display - indicates where information within a process is being displayed as part of the process itself, i.e., a login verification or notification shown to a manager for timesheets approval.

-
Data - used to show where inputs and outputs are entering and exiting the process, e.g., a user starting a motor, or switching on the power, etc.

-
Manual Input - used to present a step that involves manual entry of information by a person.

-
Or - it’s different from the diamond decision shape, in that it indicates a branching of the process, usually in more than two directions.

-
Merge - given that processes can branch off, they might also come back together. When multiple branches of a workflow meet again, you can indicate that with the merge symbol.

-
Collate Data - used when data or material in a process has to be collected and organized in a standard format, e.g., the assembly of data required to prepare for a Sprint or a Kanban retrospective.

-
Sort Data - used to indicate that information or materials must be arranged in a specific order. E.g., sorting materials by color before moving to the next step in a manufacturing process or sorting a Sprint backlog by priority.

How to create a flowchart?
While knowing these shapes could very well be all you need to build a chart, do consider the below key points to ensure your flowchart is an accurate depiction of the process, as seen by all involved.
Step 1: Define your process
Define the process, decide on its scope, and name the involved parties.
Step 2: List the process steps
Maintain the order that they are going to present in. In many cases, this will require you to take trips across the office floor to see how an item is processed.
Step 3: Translate steps into shapes in a diagram
Use the available shapes to visualize your flow. Most people using these will be familiar with their meaning, but it’s best to include a key to eliminate misunderstandings.
Step 4: Share the chart with the team
Grab your chart and ask the team for verification - did you miss anything, did you get anything wrong, have they got anything to add? It’s not always easy to be objective, so do ask others for input.
Example
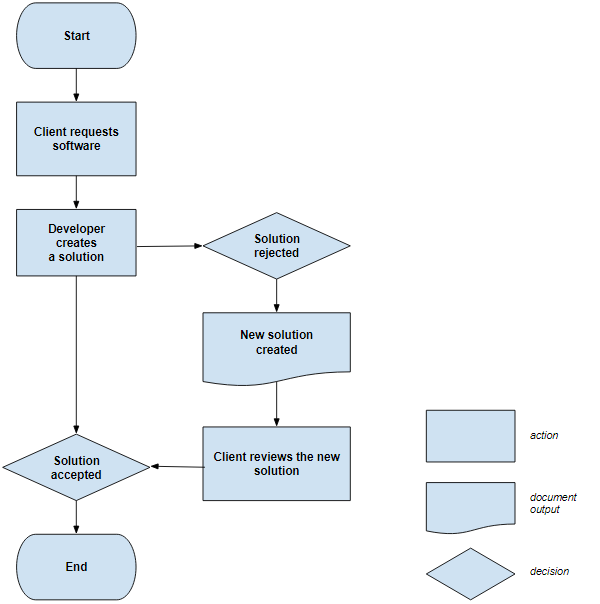
Below is a flowchart showing the processing of a basic software request.
