What is a Fishbone Diagram?

The fishbone diagram is a visual representation of the cause and effects of a problem. Through constructing the graphic, teams come to articulate an issue, which makes finding the cause of the problem easier.
Fishbone diagrams are also known as Ishikawa or cause-and-effect diagrams. They are fantastic means to understanding a problem.
Emphasizing the understanding of a problem is innate to Lean philosophy. It can lead to finding better solutions to issues, which would otherwise be causing ripple effects across the process. The application of the collective knowledge of all partaking experts results in addressing the core problems.
When is a fishbone diagram used?
This type of analysis has utility in all business activities: risk analysis, product design, project management, or quality control. Furthermore, by looking through all potential tensions and imperfections in the present systems, you can identify future issues before they become big enough to cause mayhem to the process.
Although the cause and effect diagram, with complementary techniques such as 5 Whys or Pareto charts, will help you spell out the source of a problem, it will not always be of great help with resolving it, especially if your process is highly complicated. For that part, you should turn to plan a solution with a flowchart or with good old team brainstorming, during which anyone can come up with ideas, while a leader will choose the most appropriate ones.
How to use a fishbone diagram?
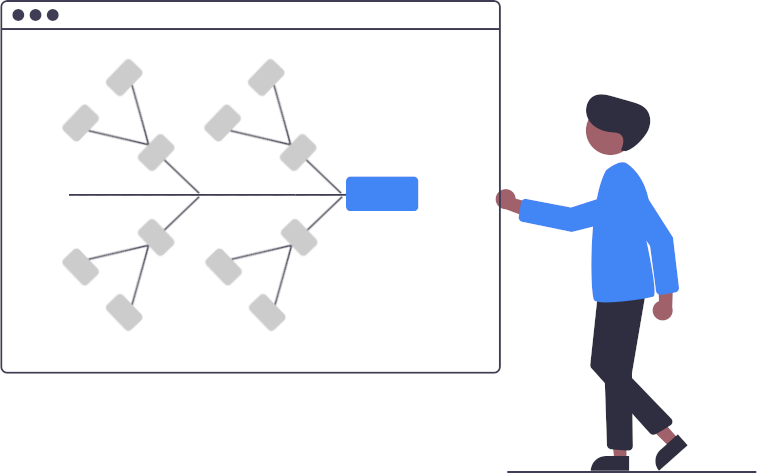
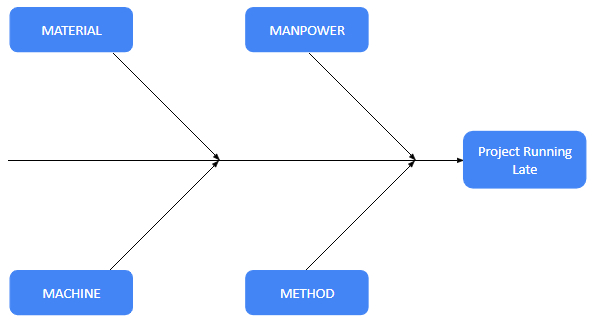
The diagram’s components are straightforward: the head is the effect or problem discussed, with bones attached to the spine being the categories of causes and the smaller bones representing the causes themselves.
Step 1: Name the problem
Show the problem to be worked on as the head. Then, draw a line from the head to the tail. If the matter at hand is a problem, its definition should be accurate and objective. And if you’re drawing the diagram to plan a change or analyze a new design - make sure to formulate the goal clearly, and make it achievable.
The fishbone diagram works on the assumption that most undesirable effects connect to several categories of causes. Still, only one or two of them will be the reason for the problem (see Pareto principle). Therefore, dealing with these few causes alone should alleviate the issue.

Step 2: Name the categories of causes
List the categories in which the core causes lie as the scales of the fish. Typical categories would be materials, machines, methods, measurements, or manpower. They show the diagram’s close relation to the 5M model. However, there can be many more cause categories, and you should match them to your specific case.

Step 3: Name the causes
The categories of causes are positioned around the fish spine and linked to it through large fishbones. Now, list the causes: actions and facts under the relevant category, showing them as smaller fishbones.
Example

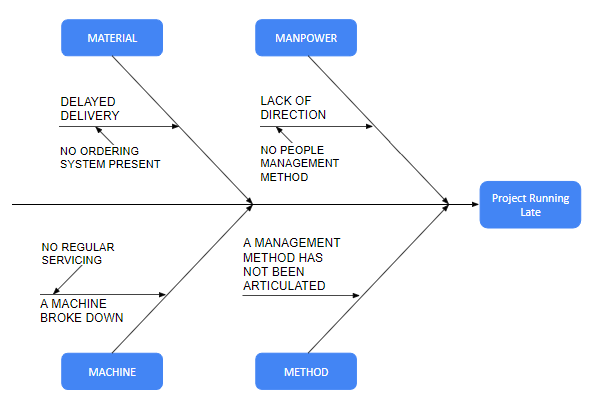
In the example above, the management method seemed unarticulated, causing the team to lack direction. At the same time, there was no system for parts ordering and no regular servicing of machines, resulting in delayed deliveries and equipment breakage. Yes, the project was delayed in part due to a lack of project management efforts and a lack of transparency of progress for the team. However, no team and process management effort will repair a damaged machine or restock the warehouse. Therefore, it is the latter two problems that need solving first. After that, the team can adopt a proper management method to ensure adequate communication and reporting to start delivering projects on time.
By naming both the possible and factual causes of the problem, the team should get closer to finding out the real cause of the situation. Listing the motives simplifies checking what has and has not been done, helping to locate the accurate source of the difficulty.
Creating a comprehensive fishbone diagram to visualize all of the caveats of your process: all aspects, all the steps, all prescribed efforts; will help you understand the way your team works and streamline it, where necessary, thereby decreasing variation. That alone will improve the way you work, alongside your customers’ experience. You’re welcome to learn more about why variation reduces productivity here.
Did you know?
Another high-impact, low-risk method to improve efficiency is using online Kanban Tool® project boards for teams. Try our intuitive, efficient visual project boards now!
Don’t swallow the whole fish at once
Similar to how you wouldn’t eat an entire fish in one go, but rather piece by piece, you should also look at the diagram’s elements one by one, starting with the one that has the most meat on it. The most wasteful thing would be to launch an initiative attempting to solve all the problems at once - manpower, method, machine, and material components. As a result, the attempt would be choked rather than tackled step by step.
What are the benefits of using a fishbone diagram?
- the ability to solve problem causes, not just their symptoms
- quick identification of process bottlenecks
- promotion of teams’ problem-solving skills growth
- the possibility of seeing the relationship between different problems, as well as between their solutions
However, it’s worth noting that fishbone diagrams are not easy to apply to complex problems, where causes and effects can be too difficult to spot in a compact criss-cross of symptoms across all process categories.