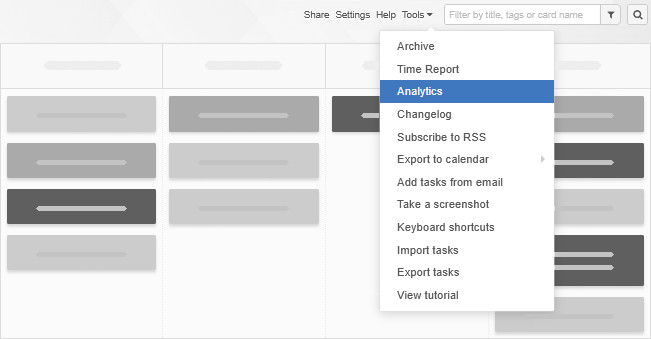
How to access Kanban Tool Analytics?
To easily track progress of your teamwork, use Kanban Tool’s automatically generated Analytics!
Just head to the Tools menu in the top right corner of your board, and select Analytics.

Inside the Analytics section you will find a Breakdown chart, a Lead & Cycle Time diagram, and a Cumulative Flow chart. Here you can learn more about what each graph is helpful with.
If you’re on the Enterprise service plan, you’ll also have access to the Time Report under Tools for even deeper process insights.
Watch the video to learn more about how Kanban Tool’s Analytics can help you measure and optimize your workflow:
