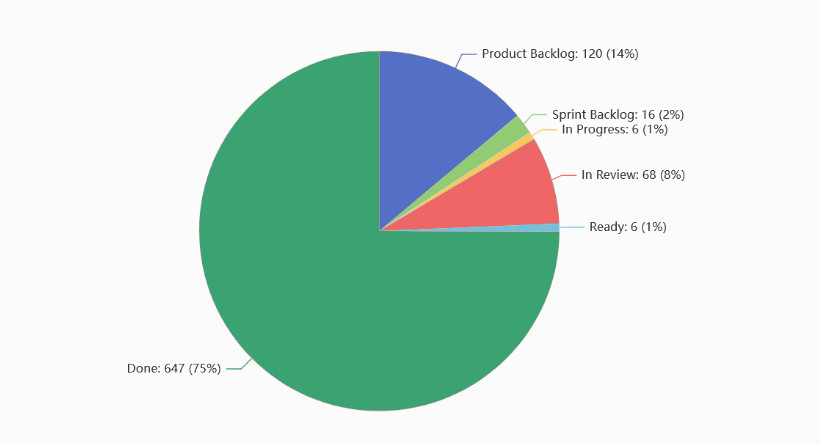
How to use the Breakdown Chart?
The Breakdown Chart helps you visualize key data from your board, making it easier to analyze task distribution, team workload, priorities, and more.
Use it to gain insights into:
- Task distribution among team members
- Task types and their share within the workflow
- Priorities and workload balance
- Assignments and individual contributions
- Size ratios of different work categories
You can analyze data for the entire board or focus on specific swimlanes, columns, column types or task types (colors) to drill down into key details.
It’s a simple yet powerful way to spot trends and optimize your workflow!
