Blog
New Power-Up Time in stage11 Jan 2021
Have you ever wondered through which of your process stages work progresses the quickest? Or, which stage is the slowest, and perhaps could do with some extra resources?
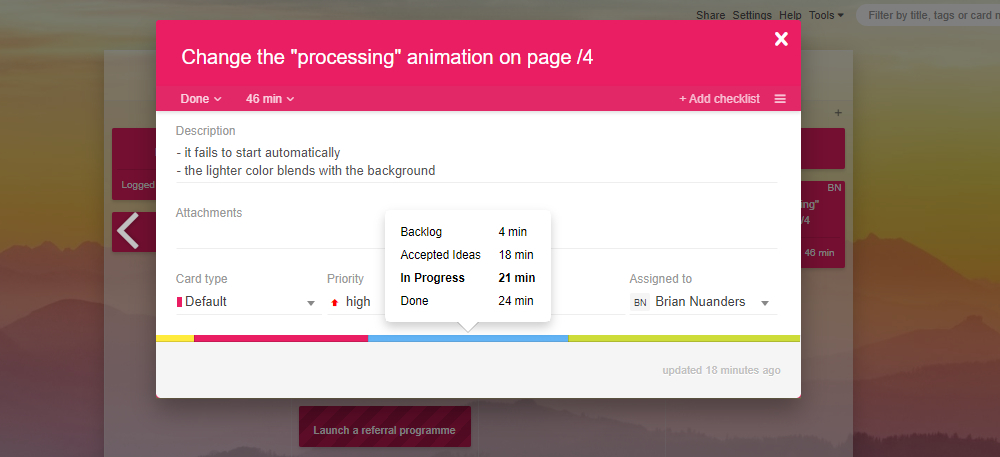
With the Time in stage Power-Up, you will see a colorful horizontal bar inside each task, representing the proportion of time the item has spent in each column. Fantastic for a super-quick processing speed analysis!

If you'd like to analyze the process speed and performance in further detail, please turn to the automatically-generated Analytics. To learn more about using Time in stage, please visit this page.
Sign up for a 14-day free trial
to test all the features.
Sign up now and see how we can help
your organization deliver exceptional results.