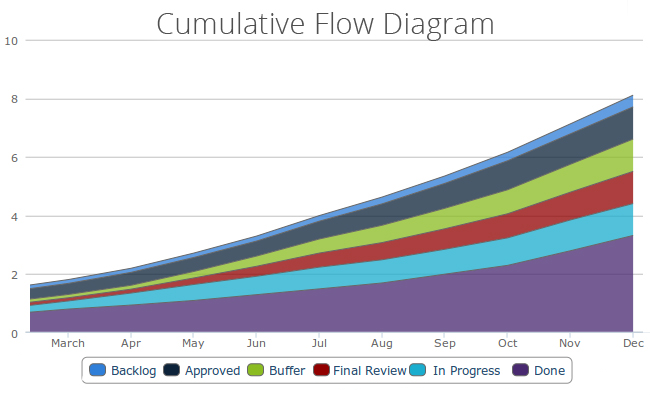
A Cumulative Flow Diagram is an analytical graph fundamental to the Kanban method. It allows teams to visualize their effort and project progress. When an impediment is about to occur within the process - the CFD is where you see it first. Instead of the graph staying smooth and rising gently, there will be a bump, a sudden ascend, or a descent. So, where being able to predict problems is concerned, this is the very graph you need.
What does it show?

The Cumulative Flow Diagram visualizes how tasks build up over time and presents their distribution along the process stages. The graph uses different colored bands to represent tasks gathered in various columns. Each color represents one column - so that each band shows how many tasks sit at what process stage in a given time - the horizontal value.
How should it look?
The ideal diagram to see is an evenly rising one, with bands staying more-less even, except for the completed tasks' representation, which should continuously be getting taller, just as the number of done tasks is hopefully forever increasing.
What to look out for?
The sight you want not to see is a sudden rise or descent within any band of tasks. That undoubtedly points to an issue. A successive accumulation of tasks in a given band indicates a bottleneck - and for as long as you notice it in time, you may be able to counteract it by addressing the issue with the team. Another thing you should look out for is the band related to your in-progress tasks getting suddenly very tall, as it would mean the number of tasks handled at present is too large, and therefore the project is likely to be delayed.
Who can benefit from it?
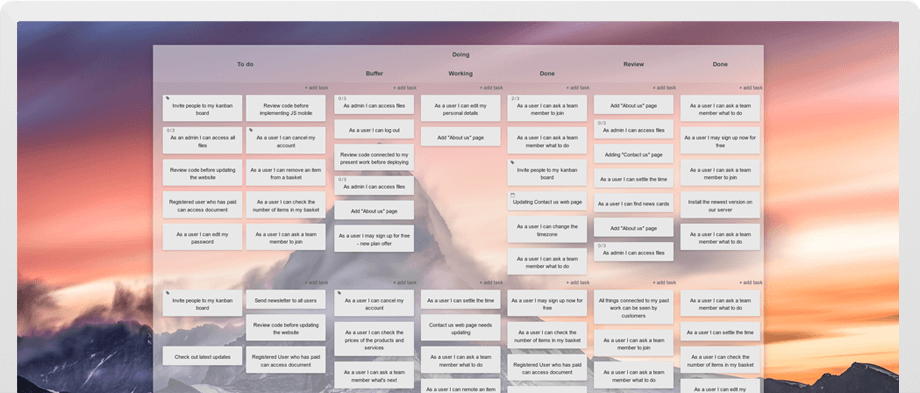
To create a CFD, you only need a rudimentary process division in your process: a Backlog lane, an In Progress column, and a Done section - using a division like this allows you to read valid and usable information from the diagram. Therefore, any team utilizing such workflow organization can benefit from the Cumulative Flow. Whether you use Scrum, Kanban, or any other project management method, as long as you organize it in task groups, the CFD will be available to help.
What are the benefits of using Cumulative Flow Diagrams?
Cumulative Flow Diagrams are not only useful for tracking your project progress and identifying potential problems but also for optimizing the workflow and improving performance. Here are some of the benefits of using CFDs:
- You can monitor your work-in-progress (WIP) levels and ensure they are within your capacity limits. This way, you can avoid overloading your system and creating waste.
- You can measure your process lead and cycle time to see how long tasks take to move from one stage to another. This way, you can identify where your process is slow or inefficient and take corrective actions.
- You can evaluate your throughput and see how many tasks you deliver within a given period. This way, you can assess your productivity and quality and set realistic expectations for your stakeholders.
- You can analyze your flow efficiency and see how much time your tasks spend in value-adding process stages versus non-value-adding ones. That would allow you to eliminate or minimize waste and improve customer satisfaction.
With Cumulative Flow Diagrams regularly, you can gain valuable insights into your workflow and make data-driven decisions to optimize your performance.
How to access a Cumulative Flow Diagram?
Consider planning your work in Kanban Tool, a flexible and easy-to-use visual management online software, that enables you to foresee and neutralize bottlenecks and impediments, as well as predict project completion time and the actual number of team members needed on it.
Apart from the Cumulative Flow Diagram, Kanban Tool gives you the most effective task visualization, endlessly customizable Kanban boards, informative task cards, adjustable Work-In-Progress limits, seamless Time Tracking, Process Automation, Power-Ups, and even more Analytics - Breakdown Chart, Lead and Cycle Time and a Time Report. So, not only will you be better informed about the project, but you will also improve your overall productivity. Try this method now for free, and see how much you can learn about your project while it is ongoing.


