Visual management is most commonly associated with the Kanban boards, and both the Kanban method and the more broad concept of process visualization - "見える化 - Mieruka" in Japanese - had a common origin half a century ago at the Toyota factory floor.

Today, Kanban boards are widely used in many industries, including software development, manufacturing, project management, and service delivery, to manage, streamline and visualize the flow of work items, and identify process blockers. The high popularity of Kanban is a testament to its effectiveness as a tool for managing workflows and projects. Thanks to the simplicity and flexibility of workflow presentation in the Kanban method, the "visual management board" term has become synonymous with the Kanban board.
However, there are several other visual management board types, such as scrum boards, Gantt charts, task boards, mind maps or other information radiators. These tools may serve purposes similat to Kanban's, but are used in different contexts. Nevertheless, they all aim to visually represent the current state of the process and help teams work more efficiently.
The common element of all these management board types is their visual part: images, colors, symbols, and other graphics representing bits of information in an easy-to-understand way.
Let's look a little closer at some examples of visual management boards and how they can benefit you:
Kanban Boards

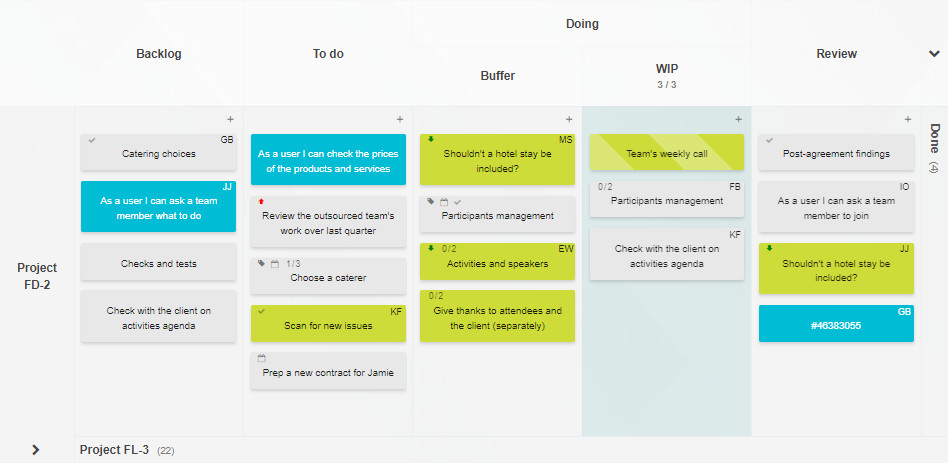
Kanban boards serve to manage projects, assignments, workflows, and teams. By splitting the workflow into columns and sticky notes resembling task cards, a Kanban board illustrates the work process, updated by the team in real time. It makes it easy to see what needs to be done, who is working on what, which items are blocked, etc.
Importantly, you can tailor Kanban boards to meet the specific needs of each team or organization. If you build your Kanban board in an online Kanban service, a bunch of additional helpful features will be available to further boost your process. With Kanban boards, you can increase efficiency and team communication, reduce waste, and improve your current process with each project.
For example, you could have columns for tasks at the Backlog, Doing, Review and Done process states. By sorting work items into columns, you will see the progress of each task at a glance and quickly identify your next steps. What's characteristic to Kanban is that you can also set Work in Progress (WIP) Limits, agreeing on a maximum number of tasks that can simultaneously find themselves in a given column. Limiting WIP simplifies work prioritization, reduces stress, and promotes finishing the already started work elements before taking on new ones.
Gantt Charts
Gantt charts take a different approach to visual management by providing a visual representation of the project timeline, making it easy to track progress and identify potential roadblocks. With Gantt charts, you can ensure that projects are on track and make informed decisions about your next steps and planned completion times.
For instance, you could use a Gantt chart to manage a product development project. You'd include information such as the start date, end date, and duration of each task, together with any dependencies between tasks. All that combined should help you understand the project timeline and plan work accordingly.
Scrum Boards
A scrum board is a visual tool most often used in the Agile software development framework. It helps teams track progress and organize work, usually prepared as user story cards. The stories make their way onto the scrum board with columns such as To Do, In Progress, and Done.
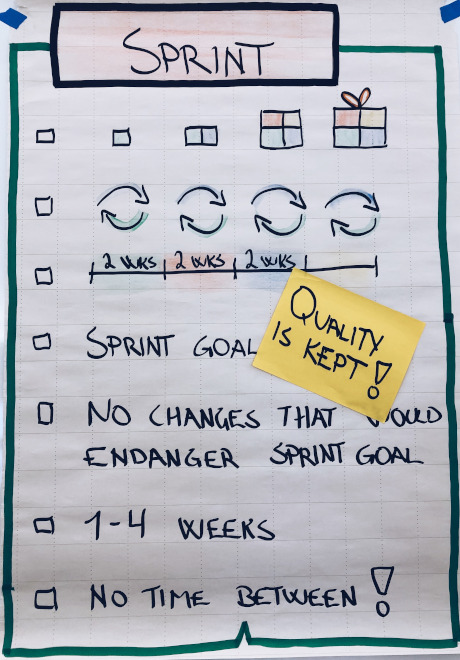
Sprints are a few weeks long intervals, and after each one, the developed product needs to be functional, with the option to set up another interval of improvements to follow. A scrum team usually maintains a limit on the number of stories to do during a sprint. Scrum boards are a simple way to structure and organize the software development process and get tasks to the finish line faster.
Mind Maps
Mind maps are typically applied to visual organization information and ideas. They allow you to brainstorm, plan, and see your thoughts in a creative way. With mind maps, you can improve your problem-solving skills, increase creativity, bring more order to your planning and hence achieve goals faster.
For example, you could create a mind map to plan a marketing campaign. You'd include information such as your target audience, the messaging, and channels, drawing the relatioships between each elelment on the map. Doing that will help you organize your thoughts, make informed decisions about the marketing strategy, and perhaps even foresee potential difficulties.

In conclusion, visual management boards are intuitive and powerful tools for tackling your workflow and achieving your goals. Whether you're working on a single project or managing multiple areas of work, visual management boards can help you stay organized, increase efficiency, make informed decisions, and simplify communication with the team.
If you'd like to test how visual management works for your team or your own task planning, try a Kanban Tool board. You can set one up in minutes and get a clear picture of your process and workload right in front of you!


