Thank you!
We have sent you an email with details about your accounts.
There are two objectives when using Kanban. One is to limit the amount of work in progress, the other is the visualization of the workflow.
What does it allow you to achieve?
We've all been told, that a picture tells a thousand words. Just imagine the impact of your spreadsheet with work data or your paper to-do list being transformed into a pleasant-to-the-eye graphic..
Thanks to making your work process visual - orderly and colorful, you're allowing yourself and your team to take the vital information in a lot quicker than when looking at an ordinary project management tool.
How does it work?
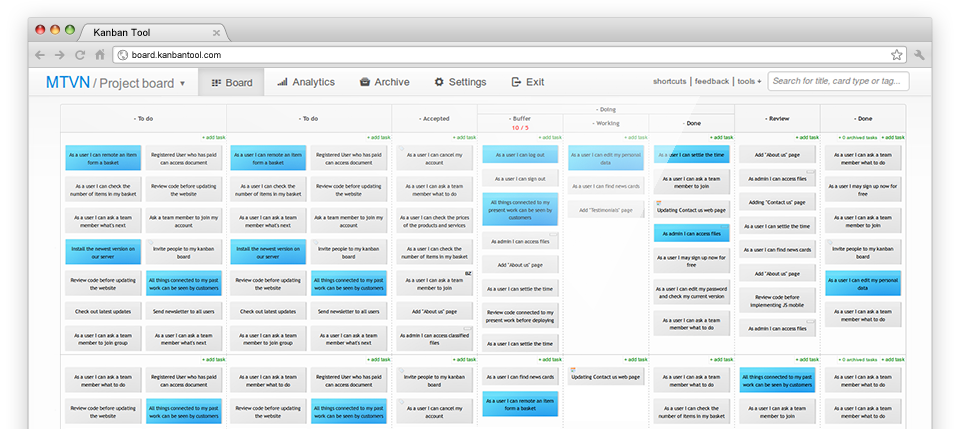
Kanban Tool is based on tasks of doable, easily manageable scope, placed on a board, divided into at least three categories: to do, doing and done. All task cards begin in the to do (backlog) part, when users are free to pull new jobs they move them over to the doing bit. When completed, the cards are slid over to done column. By following this simple rule, any team member can take a quick look at the board to immediately see who is doing what and in what stage a particular task is.
Further benefits
Because all the cards are stored on the board and archived once the tasks have been completed, it is very easy to draw analytical conclusions about the speed of the process, team members effectiveness, particular tasks difficulty. But first of all, since you're always seeing the workflow, it's dead easy to spot bottlenecks before they actually begin to affect your process.
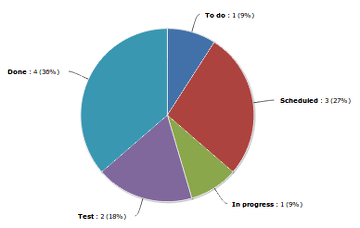
A Breakdown Chart - this simple, but insightful tool allows you to see the number of certain types of tasks across any number of columns, and gives the option to access information like tasks per user and tasks per difficulty across one or more boards. Gives a very clear picture regarding the current workflow.
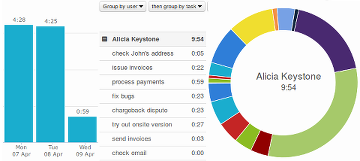
A Time Report - this is where you can see all the time logs for any or all users across one or many boards within a specific amount of time. You can view a detailed or a summary report.
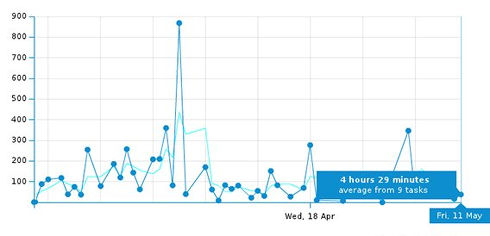
A Lead and Cycle Time Diagram - this graph will show you exactly how long it takes for a specific type of task in a particular lane to get form start to finish point or from and to any given place. It will help you see what is your team's velocity, as it allows to see the difference between how long a task has been on the board and how long it was actually worked on.
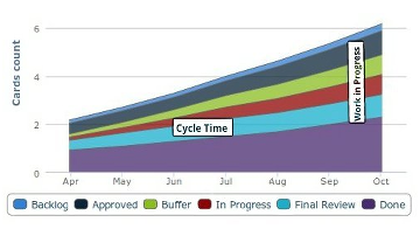
A Cumulative Flow Diagram - what this measures is the scope of work placed in any particular stage of the process within time. Ideally, what you'd like to see is a smooth graph, as this indicates that there were no obstacles along the way. As soon as you see horizontal lines or big leaps, you're being told that there have been impediments or no flow of work. Big differences in the bands' width are indicative of bottlenecks and should be resolved by re-thinking the work in progress limits.
What does this mean practically
We are always hearing how big an improvement on businesses' productivity has the use of Kanban Tool created. And it's no wonder, as the pull method allows users to grab work when they're ready, rather than hang about, but mainly just limiting the work in progress makes you more productive. As soon as you're able to concentrate on one thing at a time, your focus is better, therefore the quality of your work improves. It also impacts the work atmosphere vastly - less chaos, more understanding.
Here is an impressive Use Case, where implementation of Kanban Tool resulted with 56% increase in productivity. Hard to beat this, isn't it?
Try it out with your team! A free trial is available for all types of accounts, no credit card details required.
Sign up now for a free trial »
© 2009-2025 Kanban Tool ® by Shore Labs. All rights reserved. | All other trademarks, logos and images mentioned on this site belong to their respective owners. | We use cookies on our website.
Kanban Tool is a visual management solution that helps companies visualize workflow, track project progress, and analyze and significantly improve business processes. Kanban Tool provides powerful online Kanban boards with seamless time tracking and insightful analytics. Our Kanban software works perfectly in any business process and is designed for teams that want to visualize work on a Kanban board.