Thank you!
We have sent you an email with details about your accounts.
One of the biggest challenges, that project managers are facing is to find a way to predict their project’s future – its success, or failure. Therefore, estimating project duration, and identifying problems as they occur, are managers' essential responsibilities. However, it usually costs time and effort to gather and analyze appropriate metrics. Kanban software simplifies this process, by providing insightful analytics. Lead and Cycle Time and Cumulative Flow diagrams allow to measure the project performance, and help in identifying inefficiencies and bottlenecks.
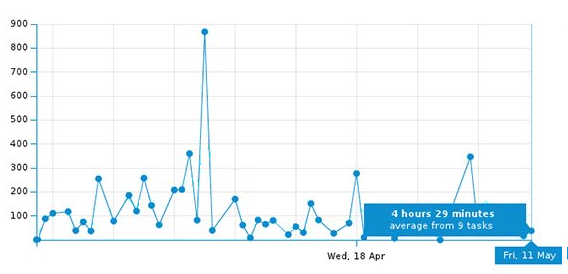
Lead and Cycle Time Diagram presents the average amount of time, that it takes for a task to be processed from a specific start to finish points. It can be used to analyze the time required to traverse work items, as well as to make improvements in project performance.
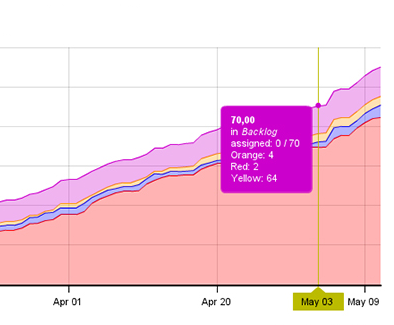
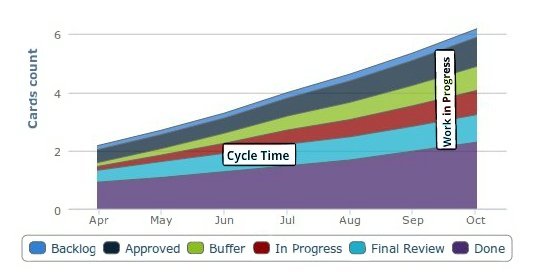
Cumulative Flow Diagram presents relative amounts of work for each stage of the project, over time. The diagram should run smoothly. Large spikes and flat horizontal lines indicate impediments to flow, or a lack of flow. Graph gaps and variations stand for bottlenecks, which often occur due to use of irrelevant work in progress limits.
By looking at the vertical distances on this chart, a project manager can define the number of items currently in progress, and set a relevant WIP limit for their team. The horizontal distances show how long it takes for a task to get completed. By measuring it, a manager can monitor the cycle time, and predict when all work is likely to be completed.
Kanban metrics allow you to predict how much time your team needs to complete a project. Thus, they help you plan and organize work, as well as to delegate responsibilities. Analytics enable you to track the average cycle time, and improve it. CFD makes project performance easily readable, letting you find bottlenecks and solve problems, exactly as they occur.
Kanban boards powered by Kanban Tool provide a wide range of insightful analytics, metrics and reports, that help to track and manage projects, like never before.
Sign up now for free trial »
© 2009-2025 Kanban Tool ® by Shore Labs. All rights reserved. | All other trademarks, logos and images mentioned on this site belong to their respective owners. | We use cookies on our website.
Kanban Tool is a visual management solution that helps companies visualize workflow, track project progress, and analyze and significantly improve business processes. Kanban Tool provides powerful online Kanban boards with seamless time tracking and insightful analytics. Our Kanban software works perfectly in any business process and is designed for teams that want to visualize work on a Kanban board.