Blog
How Visual Workflow Tracking Helps Teams Anticipate and Defuse Issues17 Jun 2025
Information build-up, misaligned priorities, and hidden dependencies quietly build pressure in all collaborative endeavor, be that software development, marketing campaign or a product launch. Unfortunately, most issues don’t announce themselves with alarm bells, but creep in under the radar, shielded by poor visibility or ambiguous ownership and response protocols. Tracking tasks visually can serve not merely as a project management aid, but as an early-warning system. Used with intent, a visual Kanban board could help a team identify where friction is building — long before it combusts into an actual bottleneck or failure.

Visual tracking mechanics
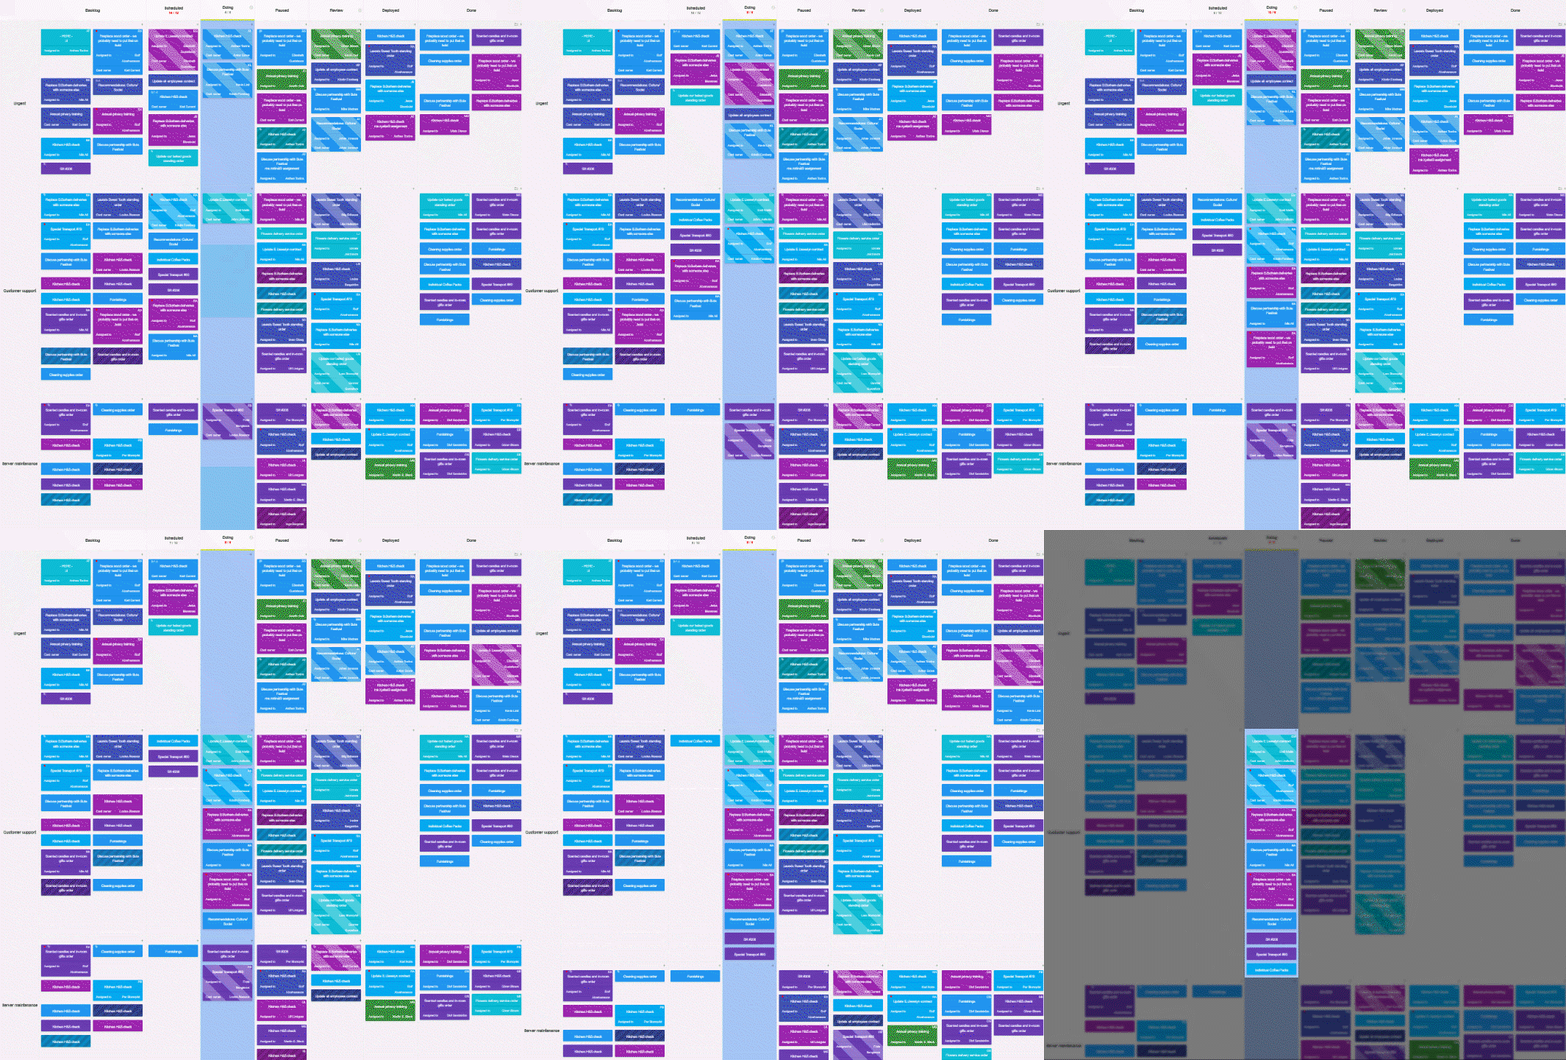
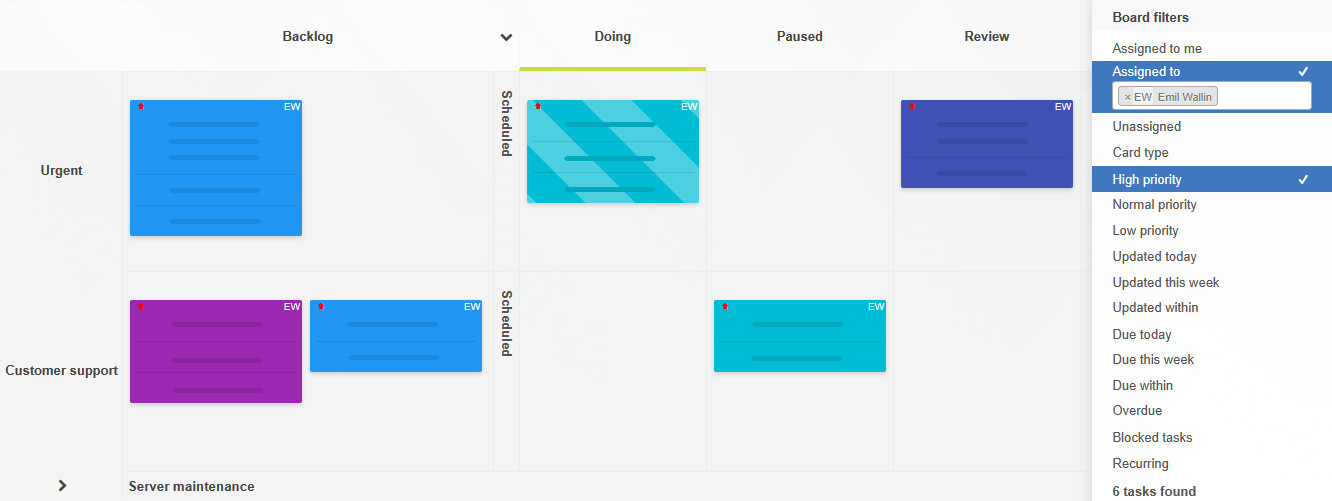
At its core, a Kanban board illustrates all of the team's work items. Tasks are broken down and represented as discrete cards moving through a series of columns — each standing for a completion state such as “To Do”, “In Progress”, or “Done”. The format is deceptively simple, yet what it enables is complex and powerful: it externalizes cognitive load, exposes process dynamics in real time, and supports collective situational awareness, costing virtually no effort.
Unlike static work-lists or Gantt charts, a live-updated Kanban board can reflect how work evolves. Instead of showing what needs to be done, it shows how it’s being done, who is doing it, where things are slowing down, and what may be colliding.
Moving from snapshots to patterns
One of the values of applying visual tracking lies in replacing a static view of tasks with the patterns that emerge from their processing over time. For example, tasks that pile up in the “In Progress” column but rarely move to “Done” reveal more than a delay — they suggest overcommitment, insufficient team competencies, unclear definitions of “done”, or ignored blockers. A sudden swell in incoming tasks without a proportional throughput up-tick signals demand-capacity imbalance. Without a clear, visual medium, these types of patterns are too easy to overlook, especially when individual team members are focused on their own slices of the workflow, which often is the case.

Making risk tangible
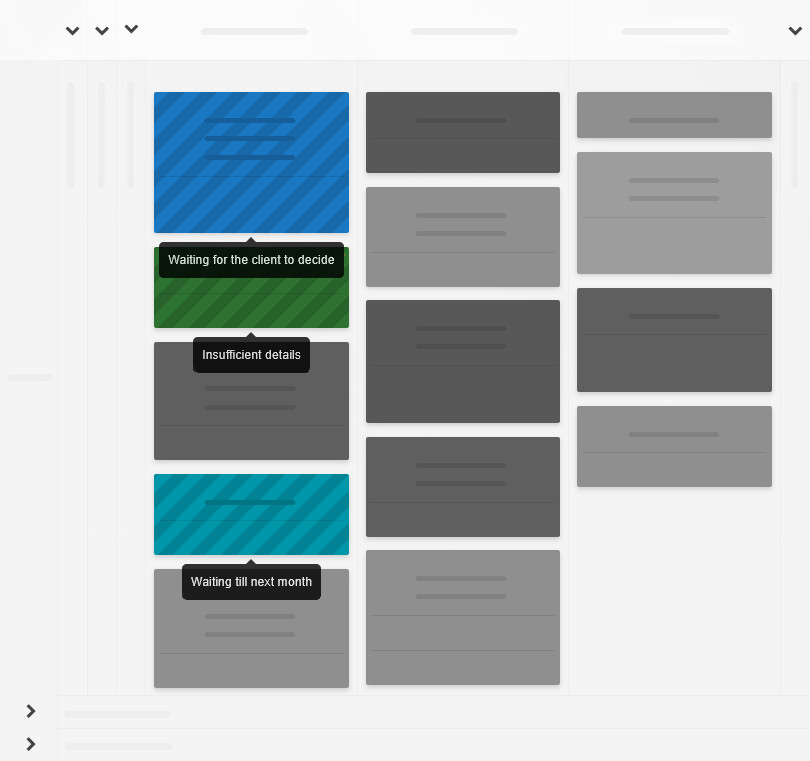
Many risk management frameworks rely on speculative identification: looking at what might go wrong. In contrast, visual workflow tracking makes risk tangible. A single card stuck in “Review” for six days while others cycle through every two or three is not only a statistical anomaly—it’s a canary. It tells some kind of a story: maybe the reviewer is overloaded, perhaps the subject of the review is ambiguous. In either case, such distinct visual stagnation compels attention and is plain to see for all board users.
Illustrative process oversight can also surface risks stemming from hand-offs and dependencies. If Task C depends on the completion of Task A, but Task A is perpetually reprioritized and pushed back, the relation turns from a functional dependency to an observable blockage. Signals like this allow teams to intervene early, adjust commitments, or escalate strategically — not reactively.

From ownership to accountability
The clarity provided by a well-maintained board — with maintenance being the key here — is able to transform responsibility from an abstract concept into observable behavior. When tasks are clearly assigned and timelines are visible to everyone, slippage becomes a team-level concern rather than a personal failing alone. Such visibility promotes healthy accountability: we are less likely to allow tasks to languish when their progress—or lack thereof—is continuously on public display.
Simultaneously, a reliance of visual systems like Kanban can help teams avoid performative productivity. Without visual tracking, there’s a tendency to measure contribution by volume — the number of emails sent, meetings attended, tickets closed. A Kanban board instead privileges flow: emphasizing the value of completing the right tasks at the right times, not performing any activity.

Visual data serving feedback
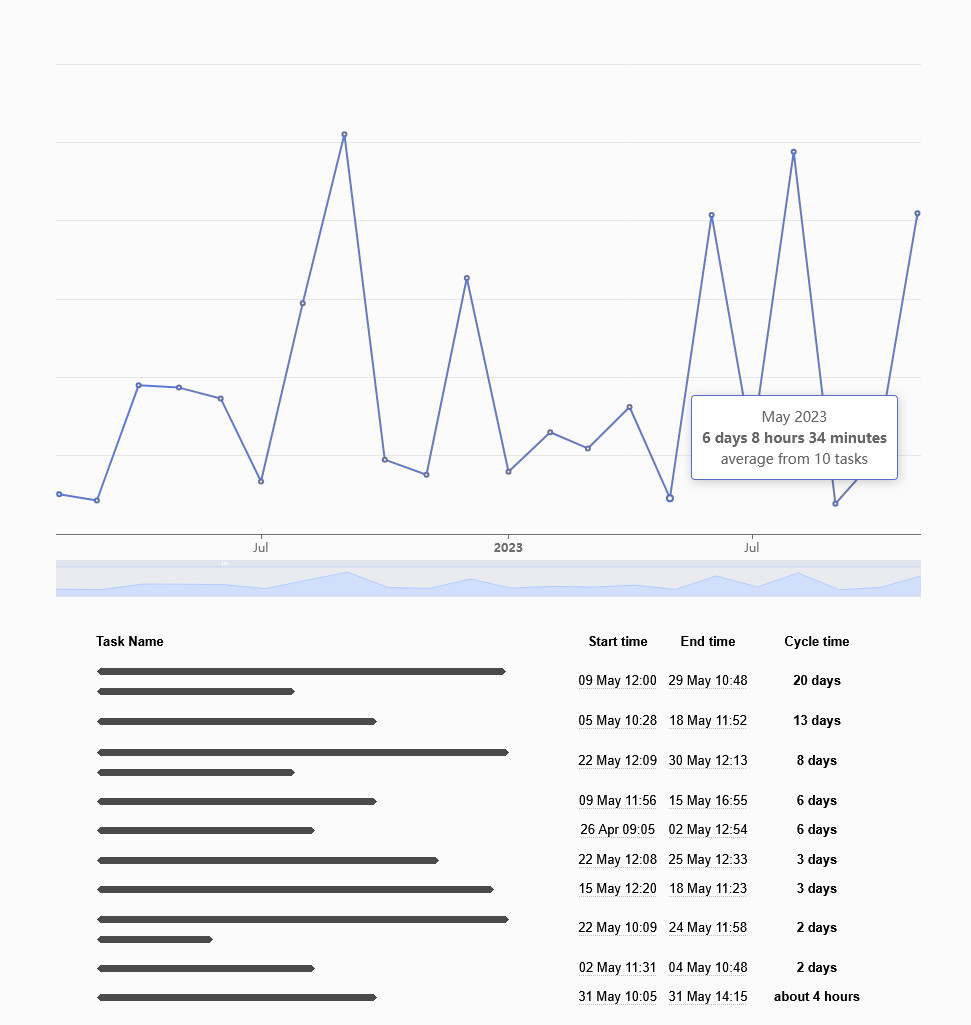
Additionally, a robust Kanban system autonomously presents operational intelligence. Metrics such as lead time (time from start to finish), cycle time (time in the active working stage), and work-in-progress levels can be extracted directly from the board. They aren't vanity metrics, but real-life feedback points. If cycle time balloons with each batch of tasks, the team can look upstream: are requirements poorly defined? Is work too fragmented? Or, if throughput fluctuates, the team could explore whether it's the work sizing that is inconsistent, or is it that interruptions are too frequent.
What makes these insights actionable is their grounding in actual tasks, processed by your team - not in hypothetical workloads of average teams. Every data point is linked to a completed unit of work that you can reflect on during retrospectives.
The cognitive advantage
Though Kanban takes roots first in manufacturing, and then software development, the underlying principle — making work visible — applies universally. Marketing teams use it to manage campaigns, legal teams to track case progress, educators to design curriculum. Visual process tracking supports executive function, creating an externalized memory of what needs doing, is being done, and is already completed. For individual professionals and teams alike, visualizing their entire workflow is essential for reducing the cognitive load, sustaining momentum and reducing overwhelm, thereby making room for high-quality focused work.
Fragile if misused
It's worth keeping in mind that none of this is automatic. A Kanban board that is cluttered, outdated, or misaligned with reality loses all of its diagnostic power. If team members routinely bypass it, or when tasks are updated retroactively to reflect ideal progress rather than factual activity, the board becomes ceremonial at best. To retain its value, visual tracking must be treated as a living artifact — not a report or a plan, but an extension of the team’s shared real-time attention.
Summing up
Systemic awareness and task management are equal roles of visual task tracking. By rendering the hidden visible, it allows teams and individuals to see how work flows —or doesn’t— before process-wide problems metastasize. It effectively replaces guesswork with signals and turns abstract risk into observable friction. In times of increasing interdependence and information overload, this form of progress visibility isn’t just helpful, but indispensable.
Sign up for a 14-day free trial
to test all the features.
Sign up now and see how we can help
your organization deliver exceptional results.