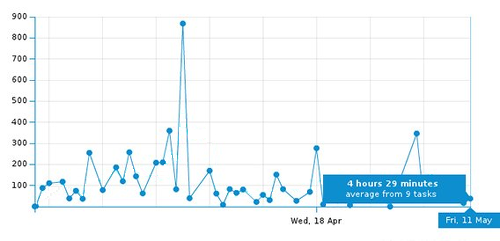
The Lead and Cycle Time Diagram is a metric characteristic to Kanban. It is the graph you'd turn to when looking for information on process throughput. Data that Lead and Cycle Time delivers, is the relation between the time tasks spend in the process on whole, and the time tasks are actively being worked on.

Why is this information crucial to your business?
The process throughput - the flow-rate of tasks and orders being placed in the system, and that flow-rate's alignment with what and exactly when is being delivered through the process - this alignment is where the real value of the organization lies. The speed, with which you can respond to a demand, and produce a worthy result is one of the first things that you'll be judged on - by both your clients and competitors.
Being aware of your process throughput empowers you to provide correct information about estimated delivery times, thereby making you a more reliable business associate. Furthermore, having this information allows you to plan your business better - knowing how busy your team is now, allows for better estimation of when will they be available to start another project - and whether it would perhaps make sense to outsource, or get hiring, in order
to facilitate a healthy business growth.
How to read the graph?
In Kanban Tool's Lead and Cycle Time you get to choose which types of tasks should be analysed. You can also define that you want a display of the general Lead and Cycle Time (the time it took for a task to get from the leftmost to the rightmost column), or you can choose a specific point for the beginning and end of the comparison (any 2 columns in between which tasks were moved). By viewing the average time it took for tasks with chosen parameters to get done, you gain insight into this highly specific process' throughput.
How to get an automatically generated Lead and Cycle Time?
Try Kanban Tool for free, and enjoy not only an automatically generated Lead and Cycle Time, but other Analytical utilities as well. With Kanban Tool you're getting a great process visualization platform with an impressive set of additional features - online attachments, comments, checklists, due dates, seamlesss Time Tracking, a Time Report, custom Process Automations, a Cumulative Flow Diagram, a Breakdown Chart and more. Test it for free now!

